SMEs in Greece: the large enterprises are missing
Small and medium-sized enterprises in Greece provide 83.0% of employment, against 63.5% in the EU-27. Micro enterprises are as common as in the EU in proportion, 94.32% and 94.33% of enterprises. Large enterprises, with 250 persons and more, provide 17.0% of employment, last place among the 27, with an EU average of 36.5%.
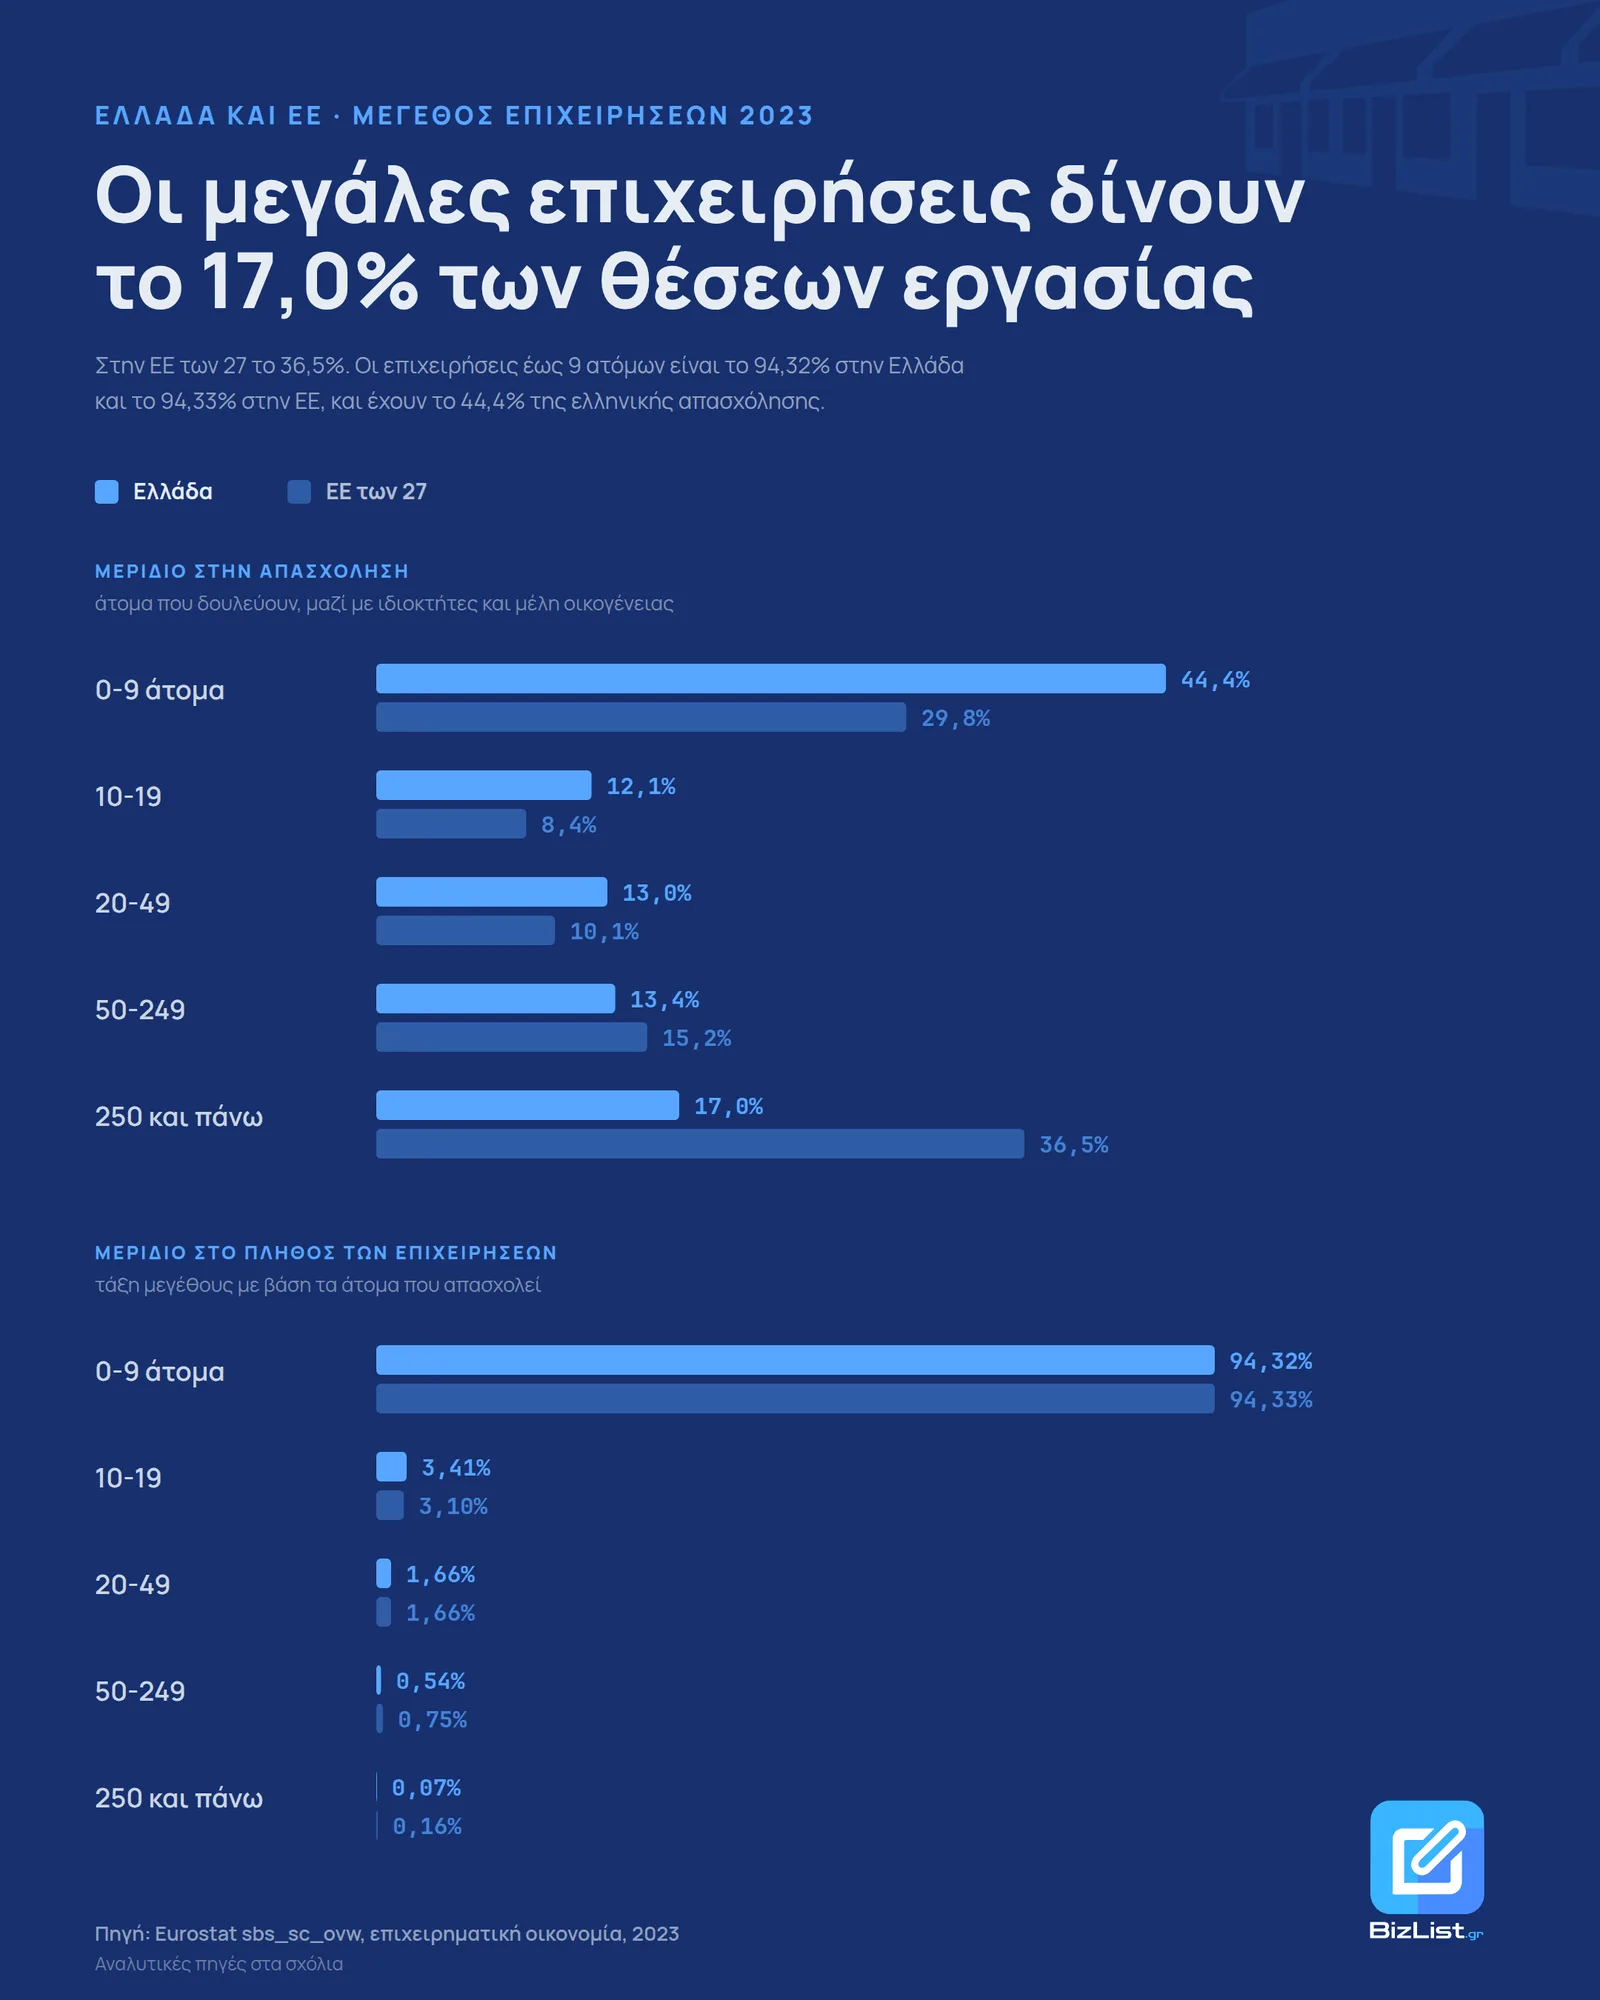
Small and medium-sized enterprises (SMEs) in Greece, with fewer than 250 persons employed, provide 83.0% of employment. In the EU-27 they provide 63.5%. Micro enterprises, up to 9 persons, are as common in Greece as in the EU in proportion: 94.32% of Greek enterprises in 2023 and 94.33% of European ones. Large enterprises, with 250 persons and more, provide 17.0% of Greek employment and 36.5% of European employment. Greece is last among the 27 member states.
I downloaded 8,622 values of the Eurostat structural business statistics: number of enterprises, employment, turnover and value added by size class, for the 27 member states, and by sector for Greece and the EU, from 2021 to 2024.
Where the gap starts
| persons employed | Greece | EU-27 |
|---|---|---|
| 0-9 | 44.4 | 29.8 |
| 10-19 | 12.1 | 8.4 |
| 20-49 | 13 | 10.1 |
| 50-249 | 13.4 | 15.2 |
| 250 and more | 17 | 36.5 |
Up to 49 persons employed, the shares of enterprises are almost identical, with a gap of at most 0.32 points. The gap grows in medium-sized enterprises: those with 50-249 persons are 0.54% of the Greek total and 0.75% of the European one. At 250 and more the share falls below half, 0.07% against 0.16%. In absolute numbers that is 679 enterprises, out of a total of 932,549.
| persons employed | enterprises, Greece | enterprises, EU | turnover, Greece | turnover, EU |
|---|---|---|---|---|
| 0-9 | 94.32% | 94.33% | 25.0% | 16.1% |
| 10-19 | 3.41% | 3.10% | 8.5% | 6.1% |
| 20-49 | 1.66% | 1.66% | 11.6% | 8.9% |
| 50-249 | 0.54% | 0.75% | 18.2% | 17.3% |
| 250 and more | 0.07% | 0.16% | 36.7% | 51.6% |
The jobs missing from large enterprises are mostly in micro enterprises. Enterprises with up to 9 persons have 44.4% of Greek employment and 29.8% of European employment. The average Greek enterprise employs 3.7 persons, while the average European one employs 4.9.
Last of the 27 member states
| country | employment in 250+ |
|---|---|
| France | 46.2% |
| Germany | 44.8% |
| Sweden | 42.8% |
| Netherlands | 40.2% |
| Belgium | 39.0% |
| Luxembourg | 38.1% |
| EU-27 | 36.5% |
| Finland | 36.3% |
| Denmark | 36.2% |
| Austria | 34.8% |
| Spain | 34.8% |
| Ireland | 33.1% |
| Poland | 33.0% |
| Romania | 32.2% |
| Czechia | 31.0% |
| Croatia | 28.7% |
| Hungary | 28.6% |
| Lithuania | 26.7% |
| Slovakia | 26.4% |
| Slovenia | 26.3% |
| Malta | 26.1% |
| Bulgaria | 26.0% |
| Italy | 25.4% |
| Latvia | 23.5% |
| Portugal | 22.9% |
| Cyprus | 18.6% |
| Estonia | 18.3% |
| Greece | 17.0% |
France and Germany are above 44%. The economies closer to the Greek one, Italy with 25.4% and Portugal with 22.9%, are also near the bottom, but 8.3 and 5.9 points higher. Closer still are Cyprus with 18.6% and Estonia with 18.3%.
The ranking does not change from year to year. Greece is last in all four years of the series, with 16.4% in 2021, 16.6% in 2022, 17.0% in 2023 and 17.4% in 2024. In three of those years some states are missing from the data: Cyprus and Portugal in 2021, Portugal in 2022 and 2024. Neither of the two came out below Greece in a year when it was measured.
How much the mix of sectors explains
The first explanation I tested was the structure of the economy. Accommodation and food services have 20.8% of employment in Greek enterprises and 7.0% in the EU, and it is a sector with few large units all over Europe. If this were the cause, Greece would have few large enterprises simply because it has a lot of tourism.
I tested it with a substitution. I kept the Greek distribution of employment across sectors and gave each sector the share of large enterprises it has in the EU. The 17.0% becomes 30.4%, while the EU in the same sectors has 35.3%. The sector mix explains 4.8 of the 18.3 points of the gap. The remaining 13.5 are within the same sector.
| sector | employment, Greece | employment, EU | in 250+, Greece | in 250+, EU |
|---|---|---|---|---|
| Trade | 24.0% | 18.4% | 19.1% | 32.9% |
| Accommodation, food services | 20.8% | 7.0% | 7.8% | 15.6% |
| Manufacturing | 11.1% | 18.7% | 25.8% | 49.3% |
| Professional, scientific | 8.4% | 7.6% | 8.8% | 19.4% |
| Transport | 5.4% | 6.4% | 19.8% | 45.1% |
| Construction | 5.3% | 8.6% | 5.2% | 13.1% |
| Administrative services | 5.1% | 8.7% | 38.1% | 52.4% |
| Information, communication | 3.2% | 4.5% | 31.8% | 43.7% |
| Personal services | 2.0% | 1.8% | 0.0% | 5.3% |
| Energy | 0.9% | 0.9% | 52.4% | 70.3% |
| Mining | 0.2% | 0.2% | 43.0% | 58.3% |
In manufacturing, large enterprises have 25.8% of employment in Greece and 49.3% in the EU. In transport, 19.8% and 45.1%. Even in accommodation and food services the Greek share is half the European one, 7.8% against 15.6%. This is although enterprises with up to 9 persons there have a smaller part of employment than in the EU, 31.9% against 38.9%.
The few large enterprises hold the value added
Enterprises with 250+ persons have 17.0% of Greek employment, 36.7% of turnover and 41.7% of value added. Their share of value added is 2.45 times their share of employment, the highest ratio in the EU-27. Ireland is second with 1.89, and the EU average is 1.35.
The same shape comes out of the financial statements, with a different measure of size. In the revenue distribution of the 2024 financial statements, 392 Greek companies with revenue above €100 million hold 45.3% of the revenue of all companies that published.
| persons employed | Greece, € thousand | EU, € thousand | Greece as % of EU | price-adjusted |
|---|---|---|---|---|
| 0-9 | 14.10 | 42.09 | 33.5% | 40.4% |
| 10-19 | 18.69 | 50.91 | 36.7% | 44.3% |
| 20-49 | 25.33 | 56.58 | 44.8% | 54.0% |
| 50-249 | 38.87 | 67.76 | 57.4% | 69.2% |
| 250 and more | 71.68 | 86.81 | 82.6% | 99.6% |
| total | 29.25 | 64.51 | 45.3% | 54.7% |
The table shows value added per person employed per year. In Greek enterprises with 250+ persons it is €71,680, 82.6% of the European level. The price level in Greece was 82.9% of the EU in 2023, and with this adjustment the share reaches 99.6%. In enterprises with up to 9 persons, value added is €14,100 per person employed, 40.4% of the European level after adjustment.
In micro enterprises the person employed is often the owner or a family member, with part-time or seasonal work. And the price adjustment is for the whole economy, not by sector. The 99.6% reads as "close to the European level" and nothing more precise.
Methodology
The source is Eurostat, structural business statistics sbs_sc_ovw, as it was on 08/10/2026 after
the update of 30/09/2026, and prc_ppp_ind for the price level. The series covers the business
economy: industry, construction and market services, without agriculture, public administration and
membership organisations. The size class counts persons employed: employees together with owners
and family members.
The comparison is for 2023, the last year with a complete EU total. For 2024 Eurostat gives the EU 250+ only as an estimate, rounded to 60 million persons employed, and without value added. Greece has 2024 and moves very little: 44.1% of employment in enterprises with up to 9 persons, 17.4% in 250+ and 36.9% of turnover in 250+. The sector substitution uses the 11 sectors where both Greece and the EU publish a share for 250+, with 86.4% of Greek employment. In the other sectors the value is not published. The European shares of 250+ in trade, food services, construction and professional services are Eurostat estimates.
The unit is the enterprise as each country's statistical office defines it, not the group. A group split into many companies counts as many smaller enterprises. So if this happens more often in Greece than elsewhere, the 17.0% underestimates large enterprises. The dataset has no data by group to measure how much. Agriculture also stays out, where a large part of the country's self-employed work. With it in, the weight of micro enterprises would be larger.
Frequently asked questions
How much employment do SMEs provide in Greece?
Does Greece have more small businesses than the EU?
How many large enterprises does Greece have?
What is a micro, small, medium-sized and large enterprise in the statistics?
Why does Greece have few large enterprises? Is tourism the reason?
Sources
- Eurostat, structural business statistics: sbs_sc_ovw, enterprises by size class and NACE sector, 2021-2024 accessed 8 Οκτωβρίου 2026
- Eurostat, price levels: prc_ppp_ind, GDP price level index, EU-27 = 100 accessed 8 Οκτωβρίου 2026
Data snapshot taken on 8 Οκτωβρίου 2026.
The bizlist.gr analyses are information drawn from public data and do not constitute tax, accounting, legal or financial advice.
Try it yourself
The same filters used in this analysis, ready to run.
A full study of your industry?
Companies, revenue, profit and the largest players in your industry, across Greece. Free for subscribers.