0.45% of Greek companies hold 45.3% of revenue
In the 2024 financial statements of Greek companies, without dormant ones, the median revenue is €239,034 and the mean €3.42 million. 392 companies make almost half.
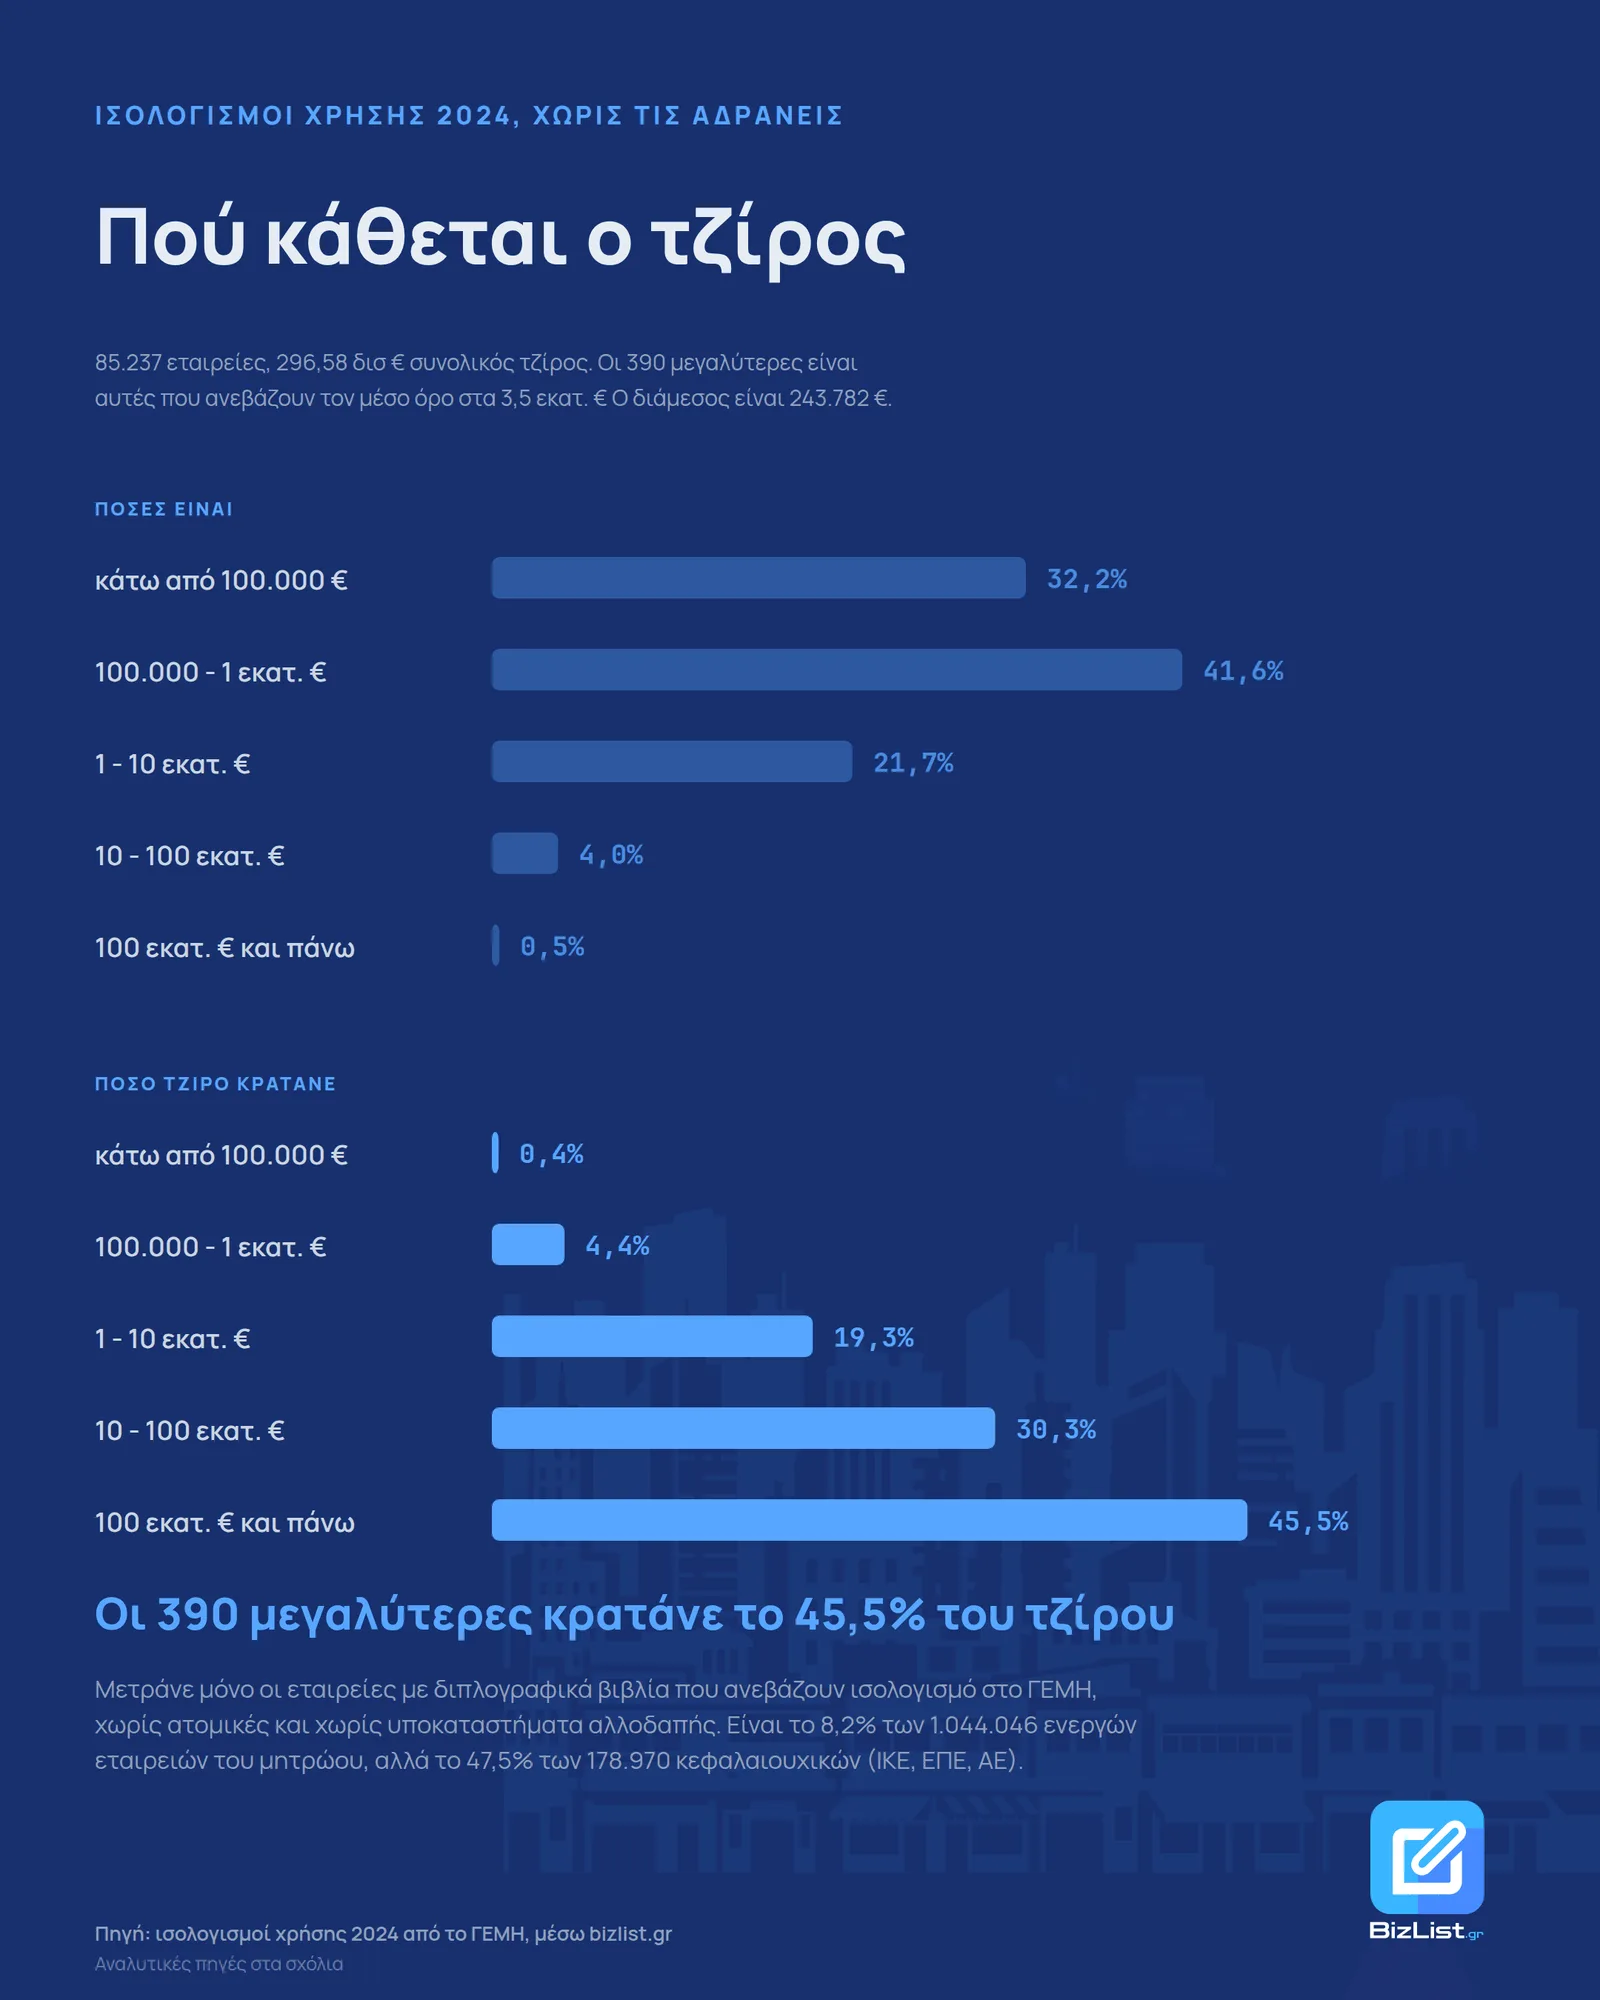
The 87,412 Greek companies that published 2024 financial statements with real revenue reported a total of €299.02 billion. They are 8.2% of the 1,066,819 active companies in GEMI, the Greek General Commercial Registry, but 46.2% of the 188,256 capital companies that must publish their accounts. The mean comes out at €3.42 million. The median is €239,034, fourteen times lower, and 88.7% of companies report less than the mean.
0.45% hold 45.3%
392 companies have revenue above €100 million. They are 0.45% of the sample and hold 45.3% of all revenue.
At the other end: the 28,484 companies below €100,000, one third of the sample, together hold 0.41%.
| revenue band | companies | % of companies | revenue | % of revenue |
|---|---|---|---|---|
| below €10,000 | 3,753 | 4.3% | €21.30 million | 0.01% |
| €10,000 - 50,000 | 13,154 | 15.0% | €378.32 million | 0.13% |
| €50,000 - 100,000 | 11,577 | 13.2% | €841.00 million | 0.28% |
| €100,000 - 500,000 | 26,727 | 30.6% | €6.46 billion | 2.16% |
| €500,000 - 1 million | 9,548 | 10.9% | €6.80 billion | 2.27% |
| €1 - 5 million | 15,492 | 17.7% | €35.09 billion | 11.73% |
| €5 - 10 million | 3,331 | 3.8% | €23.09 billion | 7.72% |
| €10 - 50 million | 3,012 | 3.4% | €61.39 billion | 20.53% |
| €50 - 100 million | 426 | 0.5% | €29.43 billion | 9.84% |
| €100 million and above | 392 | 0.4% | €135.51 billion | 45.32% |
How much a company reports at each step
| position in the distribution | revenue |
|---|---|
| top 1 in 1,000 | €346.8 million |
| top 1 in 100 | €46.9 million |
| top 1 in 20 | €8.56 million |
| top 1 in 10 | €3.96 million |
| top 1 in 4 | €1.06 million |
| median | €239,034 |
| bottom 1 in 4 | €67,920 |
| bottom 1 in 10 | €23,436 |
From the median to the top tenth the gap is sixteen times. From the top tenth to the top thousandth, another eighty-eight times.
Cumulative from the bottom:
| from the bottom | companies | share of revenue |
|---|---|---|
| the bottom half | 43,706 | 1.22% |
| the bottom 90% | 78,670 | 14.24% |
| the bottom 99% | 86,537 | 43.92% |
So the 875 companies in the top 1% hold 56.1%.
The ten largest
| # | company | revenue 2024 | % of total |
|---|---|---|---|
| 1 | Hellenic Petroleum | €11.65 billion | 3.90% |
| 2 | Sklavenitis Hellenic Hypermarkets | €5.56 billion | 1.86% |
| 3 | CORAL | €3.45 billion | 1.15% |
| 4 | Eurobank | €3.34 billion | 1.12% |
| 5 | Hellenic Fuels and Lubricants | €3.13 billion | 1.05% |
| 6 | Piraeus Bank | €2.76 billion | 0.92% |
| 7 | Alfa-Beta Vassilopoulos | €1.94 billion | 0.65% |
| 8 | METRO | €1.62 billion | 0.54% |
| 9 | HERON | €1.56 billion | 0.52% |
| 10 | DEPA Commercial | €1.44 billion | 0.48% |
Together the ten make €36.44 billion, 12.19%. Four of them sell fuel or energy, two are banks and three are supermarkets. In fuel and in supermarkets the full revenue passes through the company's books while the margin stays small. So the top of the table says more about volume of trade than about profitability.
Going up: the 100 largest make 29.15%, the 1,000 largest make 57.89%, the 5,000 largest make 79.05%.
Legal form follows size
| legal form | companies | revenue | mean revenue |
|---|---|---|---|
| private company (IKE) | 50,628 | €28.44 billion | €561,734 |
| SA | 26,367 | €249.43 billion | €9.46 million |
| limited liability company (EPE) | 10,049 | €17.34 billion | €1.73 million |
| limited partnership (EE) | 702 | €765.1 million | €1.09 million |
| general partnership (OE) | 477 | €877.5 million | €1.84 million |
| limited liability cooperative (SynPE) | 333 | €1.96 billion | €5.90 million |
IKEs are the most numerous but hold 9.5% of revenue. SAs are half as many and hold 83.4%. The IKE became the default choice for every new company in Greece. That shows in the count, not in the size.
Methodology
The source is the 2024 financial statements as published in GEMI, as read and analysed by bizlist. Retrieved on 1 September 2026. Financial years that end within 2024, in euro.
Three filters change the result. Out go the 951 branches of foreign companies, which report €768.47 billion, two and a half times the whole sample: that is the worldwide revenue of their parent, not activity in Greece. Out go the 90 consolidated statements of listed companies, with €75.94 billion, because they count the same revenue once in the parent and once in the subsidiary. Out go the 1,476 dormant companies with revenue below €2,000, which file statements so they are not struck off. With the dormant companies in, the median came out at €228,591 instead of €239,034, and the shares of the top companies were the same to the second decimal. So the concentration is not caused by empty shells. 87,412 companies remain.
The sample is the companies that uploaded financial statements: 8.2% of the 1,066,819 active companies in the registry, but 46.2% of the 188,256 capital companies that must publish. None of the 676,257 active sole proprietorships is in it, and of the OEs and EEs only 6 in 1,000.
| legal form | active in GEMI | in the sample | coverage |
|---|---|---|---|
| Sole proprietorship | 676,257 | 0 | 0% |
| IKE | 114,973 | 50,628 | 44.0% |
| OE | 96,872 | 477 | 0.5% |
| EE | 92,018 | 702 | 0.8% |
| SA | 53,117 | 26,367 | 49.6% |
| EPE | 20,166 | 10,049 | 49.8% |
What is missing sits at the bottom of the distribution. So the real concentration at the top is higher than the numbers show. Another factor works in the same direction: a group counts as its separate companies, so Sklavenitis counts as its parent company and not as the sum of its subsidiaries. And revenue is not profit: a refinery moves huge revenue at a small margin, while a software company does the opposite. The distribution of revenue is not a distribution of wealth.
Frequently asked questions
What is the average revenue of a Greek company?
How concentrated is company revenue in Greece?
Which is the largest Greek company by revenue?
Is the picture caused by dormant companies that do not operate?
Sources
- 2024 financial statements as published in GEMI (Greece), via bizlist.gr accessed 1 Σεπτεμβρίου 2026
- GEMI, the Greek General Commercial Registry accessed 1 Σεπτεμβρίου 2026
Data snapshot taken on 1 Σεπτεμβρίου 2026.
The bizlist.gr analyses are information drawn from public data and do not constitute tax, accounting, legal or financial advice.
Try it yourself
The same filters used in this analysis, ready to run.
A full study of your industry?
Companies, revenue, profit and the largest players in your industry, across Greece. Free for subscribers.