How much profit does a Greek company make, 2024
Across 88,122 sets of 2024 financial statements of Greek companies, the median pre-tax profit is €19,487 and the mean is €292,941. 28.5% of companies made a loss, and 16 companies hold 27.14% of all profits.
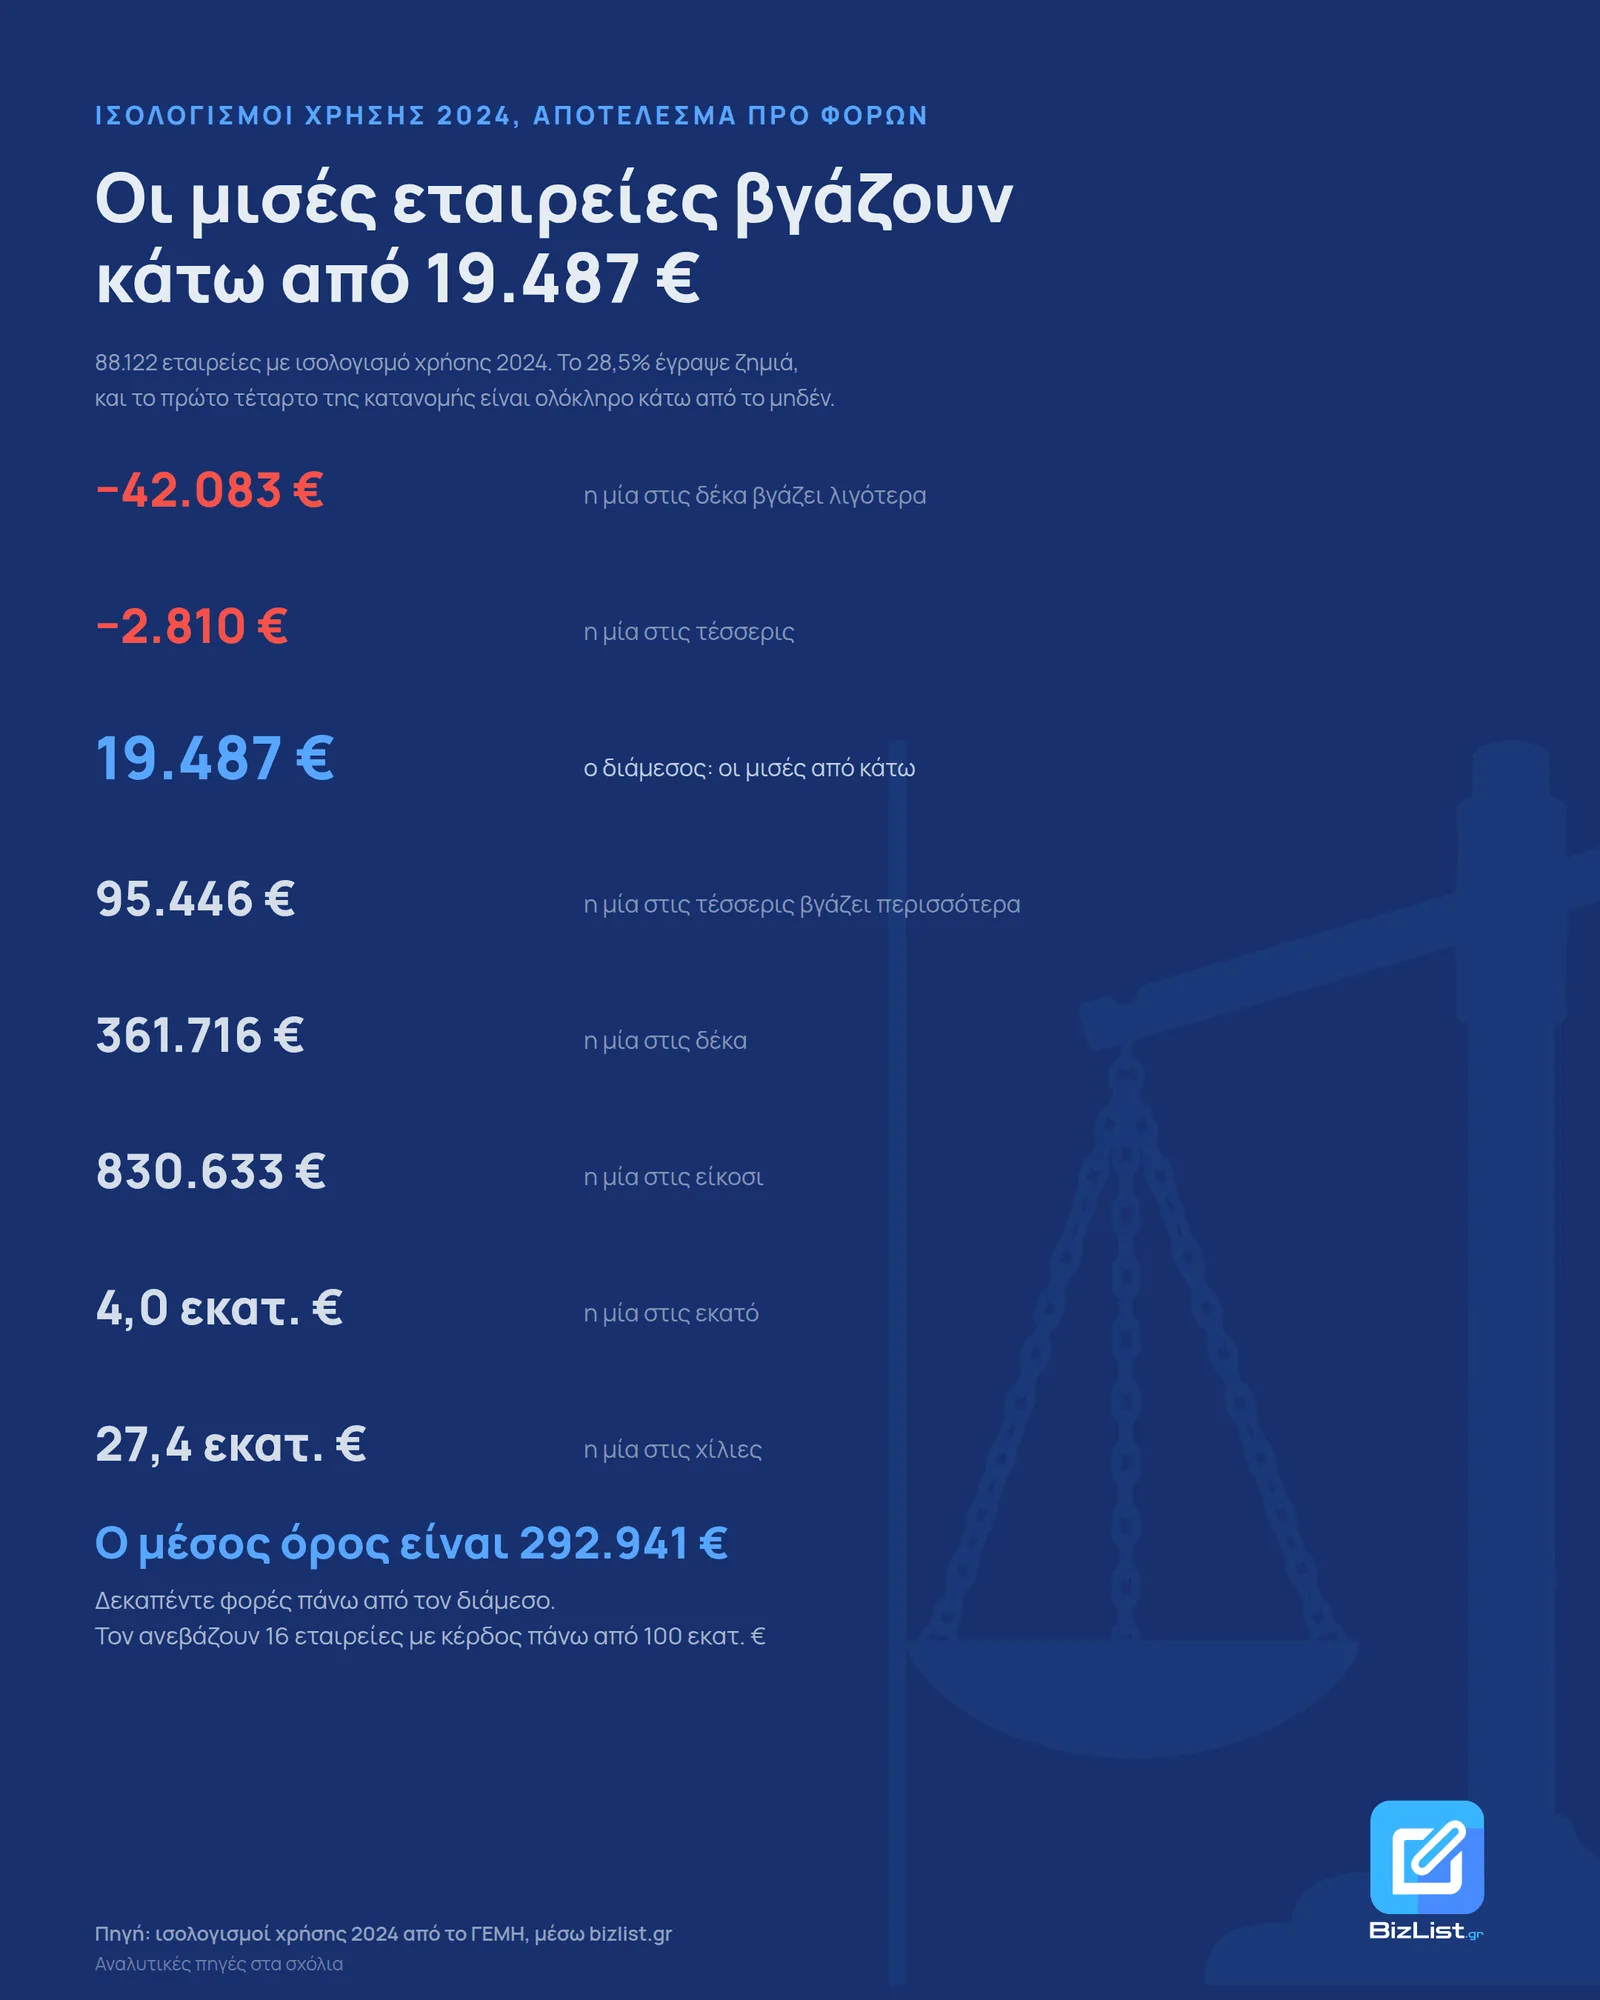
I took the pre-tax profit from every set of 2024 financial statements uploaded to GEMI, the Greek General Commercial Registry. That is 88,122 Greek companies. I put them in order. The middle one sits at €19,487, which is €1,624 a month. Half of the Greek companies that keep double-entry books made less than that before tax.
The arithmetic mean is €292,941, fifteen times the median. And 25,145 companies, 28.5%, made a loss.
Where the middle company sits
The first quarter of the distribution is entirely below zero: at the 25th percentile the result is −€2,810. The line crosses into positive somewhere between the first and the second quarter, and from there it climbs slowly. The 75th percentile is €95,446, the 90th is €361,716.
| pre-tax result | companies |
|---|---|
| profit €10,000 - €100,000 | 29,755 |
| profit €100,000 - €1 million | 17,784 |
| loss €10,000 - €100,000 | 12,534 |
| profit under €10,000 | 11,656 |
| loss under €10,000 | 7,908 |
| loss €100,000 - €1 million | 4,028 |
| profit €1 - €10 million | 3,390 |
| loss €1 - €100 million | 671 |
| profit €10 - €100 million | 281 |
| exactly zero | 95 |
| profit €100 million and over | 16 |
| loss €100 million and over | 4 |
The largest band is "profit €10,000 to €100,000" with 29,755 companies, a third of the sample. Together they hold €1.21 billion, which is 3.90% of all profits.
Losses are few and heavy
The 25,145 loss-making companies lost €5.18 billion in total. The loss is not spread evenly: 675 companies with a loss over €1 million carry €3.56 billion, 68.59% of the total. The other 24,470 share the remaining third.
At the top of the list sit infrastructure and state-owned companies.
| company | pre-tax loss | revenue |
|---|---|---|
| Hellenic Metro (Elliniko Metro) | −€188.56 million | €854,807 |
| Hellenic Railways Organisation (OSE) | −€171.51 million | €48.44 million |
| Energean Oil & Gas | −€130.91 million | €48.47 million |
| Egnatia Odos | −€103.31 million | €117.93 million |
| Mytilineos Natural Gas Supply and Trading | −€90.00 million | €4.12 million |
| DEPA Commercial | −€78.15 million | €1.03 billion |
| Hellenic Train | −€62.86 million | €51.72 million |
| Pharmathen | −€54.46 million | €250.46 million |
| Hellenic Aerospace Industry | −€49.19 million | €89.53 million |
| Avramar Aquaculture | −€47.93 million | €275.70 million |
Sixteen companies hold 27% of the profits
The €31.00 billion of profit reported by the 62,882 profitable companies is concentrated very high up.
| measure | share |
|---|---|
| of the sample | 0.02% |
| of the profits | 27.14% |
The top 392 hold 52.75% of profits, the top 1,000 hold 62.89%. At the other end, the bottom half of the profitable companies, 31,441 companies, hold 1.81% together.
The first is Titan Cement SA with €2.60 billion, 8.40% of all the profits in the country. The number does not come from cement: operating profit for the year was €20.99 million, while income from participations was €1.50 billion and gains from the sale of participations €1.11 billion. It is the group restructuring, passed through the books of the Greek parent.
| company | pre-tax profit | revenue |
|---|---|---|
| Titan Cement SA | €2.60 billion | €392.43 million |
| Eurobank | €1.85 billion | €3.34 billion |
| Piraeus Bank | €1.44 billion | €2.76 billion |
| Papastratos | €466.45 million | €905.00 million |
| Hellenic Petroleum | €359.15 million | €11.65 billion |
| Athens International Airport | €304.47 million | €665.51 million |
| IPTO (ADMIE) | €196.73 million | €469.17 million |
| Optima bank | €176.64 million | €253.65 million |
| Titan Atlantic Cement | €147.36 million | €148.85 million |
| HEDNO (DEDDIE) | €143.22 million | €1.20 billion |
Hellenic Petroleum is the clearest picture of how differently the two measures are distributed: first in the country in revenue with €11.65 billion, fifth in profit with €359.15 million.
Profit follows revenue, with one exception
The total revenue of the 88,122 companies is €289.33 billion. If we split the sample into revenue bands and look at how much of each measure each band holds, the two shares run almost in parallel.
| revenue band | revenue | profits |
|---|---|---|
| < €100,000 | 0.42 | 1.42 |
| €100,000 - €1 million | 4.55 | 7.57 |
| €1 - €10 million | 20.01 | 21.79 |
| €10 - €100 million | 31.2 | 25.76 |
| > €100 million | 43.81 | 43.46 |
The 365 companies with revenue over €100 million hold 43.81% of revenue and 43.46% of profits. They almost match. The gap is in the €10 to €100 million band, which makes 31.20% of revenue and earns 25.76% of profits. The small companies of €100,000 to €1 million make 4.55% of revenue and earn 7.57% of profits.
The same shows in the share of loss-making companies, which falls as revenue grows and then turns back up:
| revenue | companies | loss-making |
|---|---|---|
| under €100,000 | 29,582 | 46.0% |
| €100,000 - €1 million | 36,022 | 23.9% |
| €1 - €10 million | 18,727 | 13.2% |
| €10 - €100 million | 3,426 | 11.6% |
| €100 million and over | 365 | 14.2% |
Among the largest companies in Greece, the share of loss-making companies rises again to 14.2%, above the 11.6% of the next band down. They are 52 companies, and the infrastructure companies of the earlier table sit among them.
Which legal form makes the money
The 26,269 SAs in the sample hold 83.62% of profits. The 49,975 private companies (IKE), almost twice as many, hold 10.45%, and almost one in three of them (30.8%) is loss-making. Among SAs the share of loss-making companies is 26.6%, among limited liability companies (EPE) 22.4%.
Methodology
The source is the 2024 financial statements as published in GEMI, in euros, retrieved on 4 October 2026 from the bizlist.gr database. The measure is the pre-tax result, not the after-tax one.
The 967 branches of foreign companies are excluded. They report €113.11 billion of profit, more than three times the whole sample, because they record the global result of their parent. The 88 consolidated financial statements of listed companies are also excluded, since they would count the subsidiaries a second time. One record per company is kept, the latest for the year.
The concentration shares are measured against the €31.00 billion of the profitable companies and not against the net result of €25.81 billion. The net figure is smaller because it subtracts the losses of other companies, so as a denominator it would inflate every share: the top 1,000 would "hold" 75.5% instead of 62.89%.
I tried to cut the records with profit larger than total assets, on the reasoning that profit ends up in equity and equity does not exceed assets. There are 897 such records, and the filter also removed TITAN. I read five of the PDFs and four of the values were correct: a company that receives dividends or sells participations and distributes them within the year closes December with small assets and a large profit, legally. The filter was dropped. The fifth was indeed a misreading and was corrected before these numbers were produced.
Only companies that keep double-entry books and upload financial statements to GEMI are counted. They are 8.3% of the 1,060,088 active Greek legal entities in the registry, but 46.6% of the 188,969 companies with share capital. No sole proprietorship is included. What is missing sits at the bottom of the distribution, where profits are small or negative. So the real concentration is higher than the one I measure, and the median of €19,487 is higher than it would be with all businesses included.
Frequently asked questions
How much profit does an average Greek company make?
How many Greek companies are loss-making?
Which Greek company had the largest profit in 2024?
Is profit more concentrated than revenue in Greece?
Sources
- 2024 financial statements as published in GEMI (Greece), via bizlist.gr accessed 4 Οκτωβρίου 2026
- GEMI, the Greek General Commercial Registry accessed 4 Οκτωβρίου 2026
Data snapshot taken on 4 Οκτωβρίου 2026.
The bizlist.gr analyses are information drawn from public data and do not constitute tax, accounting, legal or financial advice.
Try it yourself
The same filters used in this analysis, ready to run.
A full study of your industry?
Companies, revenue, profit and the largest players in your industry, across Greece. Free for subscribers.