The economic geography of Greece in four zones
Attica has 36.6% of Greek businesses and 73.4% of revenue. It produces three times as much as the rest of Greece combined.
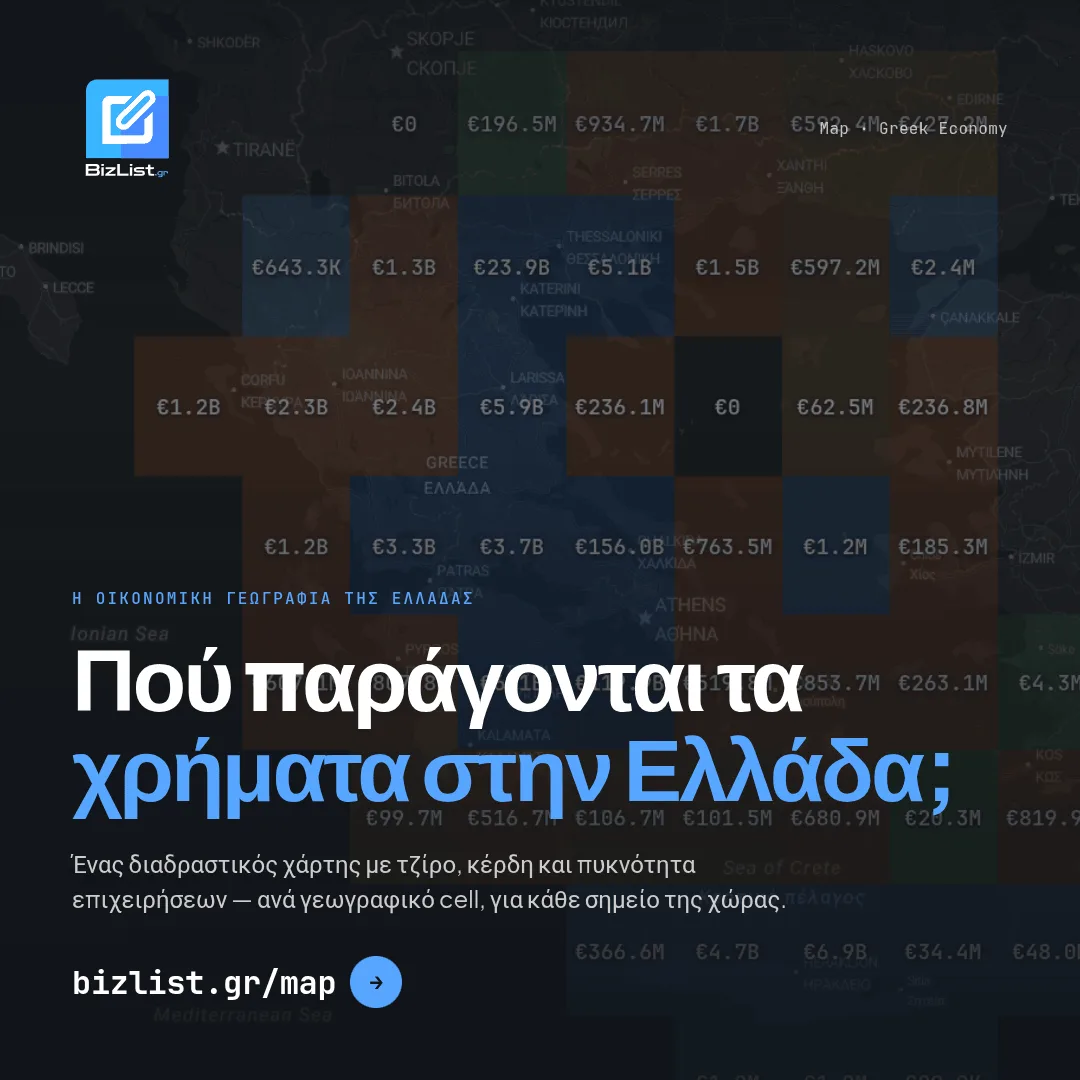
Attica has 36.6% of Greek businesses and 73.4% of revenue.
The number comes from adding up the reported revenue and profit of every company that has filed financial statements, by region of the registered seat.
Four Greeces
| area | active businesses | revenue | profit | margin |
|---|---|---|---|---|
| Attica | 383,276 | €272.6 billion | €25.06 billion | 9.2% |
| Northern Greece | 241,936 | €39.6 billion | €2.60 billion | 6.6% |
| Rest of the mainland | 228,011 | €26.0 billion | €1.59 billion | 6.1% |
| Islands | 182,604 | €20.3 billion | €1.76 billion | 8.7% |
| area | % of revenue |
|---|---|
| Attica | 73.4% |
| Northern Greece | 10.7% |
| Rest of the mainland | 7.0% |
| Islands | 5.5% |
Attica alone produces three times the revenue of the rest of the country combined. €272.6 billion against €85.9 billion.
Northern Greece, with 241,936 businesses, that is two thirds of the number in Attica, makes one seventh of its revenue.
The size of the average business
| area | average revenue per company with financial statements |
|---|---|
| Attica | €4.58 million |
| Northern Greece | €1.88 million |
| Rest of the mainland | €1.54 million |
| Islands | €1.21 million |
The average Attica company that publishes financial statements is three to four times the size of the average company anywhere else.
In profit margin the picture is different: Attica at 9.2%, the islands at 8.7%, the mainland provinces at 6.1%. The islands make small revenue with a relatively good margin, which fits with tourism and services.
The seat is not the factory
The 73.4% needs a serious caveat: it is added up at the registered seat, not at the place of production.
A manufacturer with a factory in Boeotia and head offices in Marousi counts entirely in Attica. The same goes for a retail chain with 200 stores across the country.
The 73.4% measures where the financial statements are signed. A part of it, which I cannot quantify from these data, is produced elsewhere.
This does not cancel the finding, it defines it. The concentration of corporate seats in Attica is real and has consequences for taxes, office jobs and the services around them.
Methodology
The source is GEMI, the Greek General Commercial Registry, and the published financial statements, snapshot of August 2026. Active companies with a registered seat in Greece, 1,048,039 in total, of which 114,190 have analysed financial data for the latest financial year.
Two filters are necessary in revenue sums and without them the result is useless:
- Branches of foreign companies out. They report the worldwide revenue of their group.
- Only
currency = EUR. Otherwise amounts in other currencies are added up as euros.
To show the scale: with the filters, Attica comes to €272.6 billion. Without them, it comes to €1,064.2 billion. Four times the number, completely imaginary.
The zones: Attica is its four regional units. Northern Greece is Macedonia, Thrace and Epirus. Islands are Crete, the Dodecanese, the Cyclades, the Ionian Islands and the North Aegean. Rest of the mainland is Thessaly, Central Greece outside Attica, and the Peloponnese.
What these numbers do not say
Only those that publish financial statements. That is 114,190 of 1,048,039, or 11%. Sole proprietorships, general partnerships (OE) and limited partnerships (EE) have no obligation to publish, so their revenue is missing entirely. The "active businesses" column counts them, the "revenue" column does not.
12,212 businesses have no regional unit recorded, and the 631 of them that have financials carry €13.1 billion. They are large companies with an incomplete address. They stay outside the four zones, and for this reason the shares add up to 96.5%.
Latest available financial year, which is not the same for every company.
The interactive map with revenue, profit and business density by location is on the map, and the rankings by regional unit are in the top lists.
Frequently asked questions
How concentrated is the Greek economy in Attica?
Which area of Greece has the most profitable businesses?
Why do revenue sums need filters?
Sources
- GEMI registry (Greece) and published financial statements, via bizlist.gr accessed 25 Αυγούστου 2026
Data snapshot taken on 25 Αυγούστου 2026.
The bizlist.gr analyses are information drawn from public data and do not constitute tax, accounting, legal or financial advice.
Try it yourself
The same filters used in this analysis, ready to run.
A full study of your industry?
Companies, revenue, profit and the largest players in your industry, across Greece. Free for subscribers.