Office and manual work in Greece: public and private sector
Among public sector employees in Greece, 68.1% are in office jobs, mostly teachers and doctors, and in the private sector 41.4% (2020, ILOSTAT). Across the whole economy office jobs are 43.7% in 2025, 26th in the EU, last in technicians and first in services and farmers.
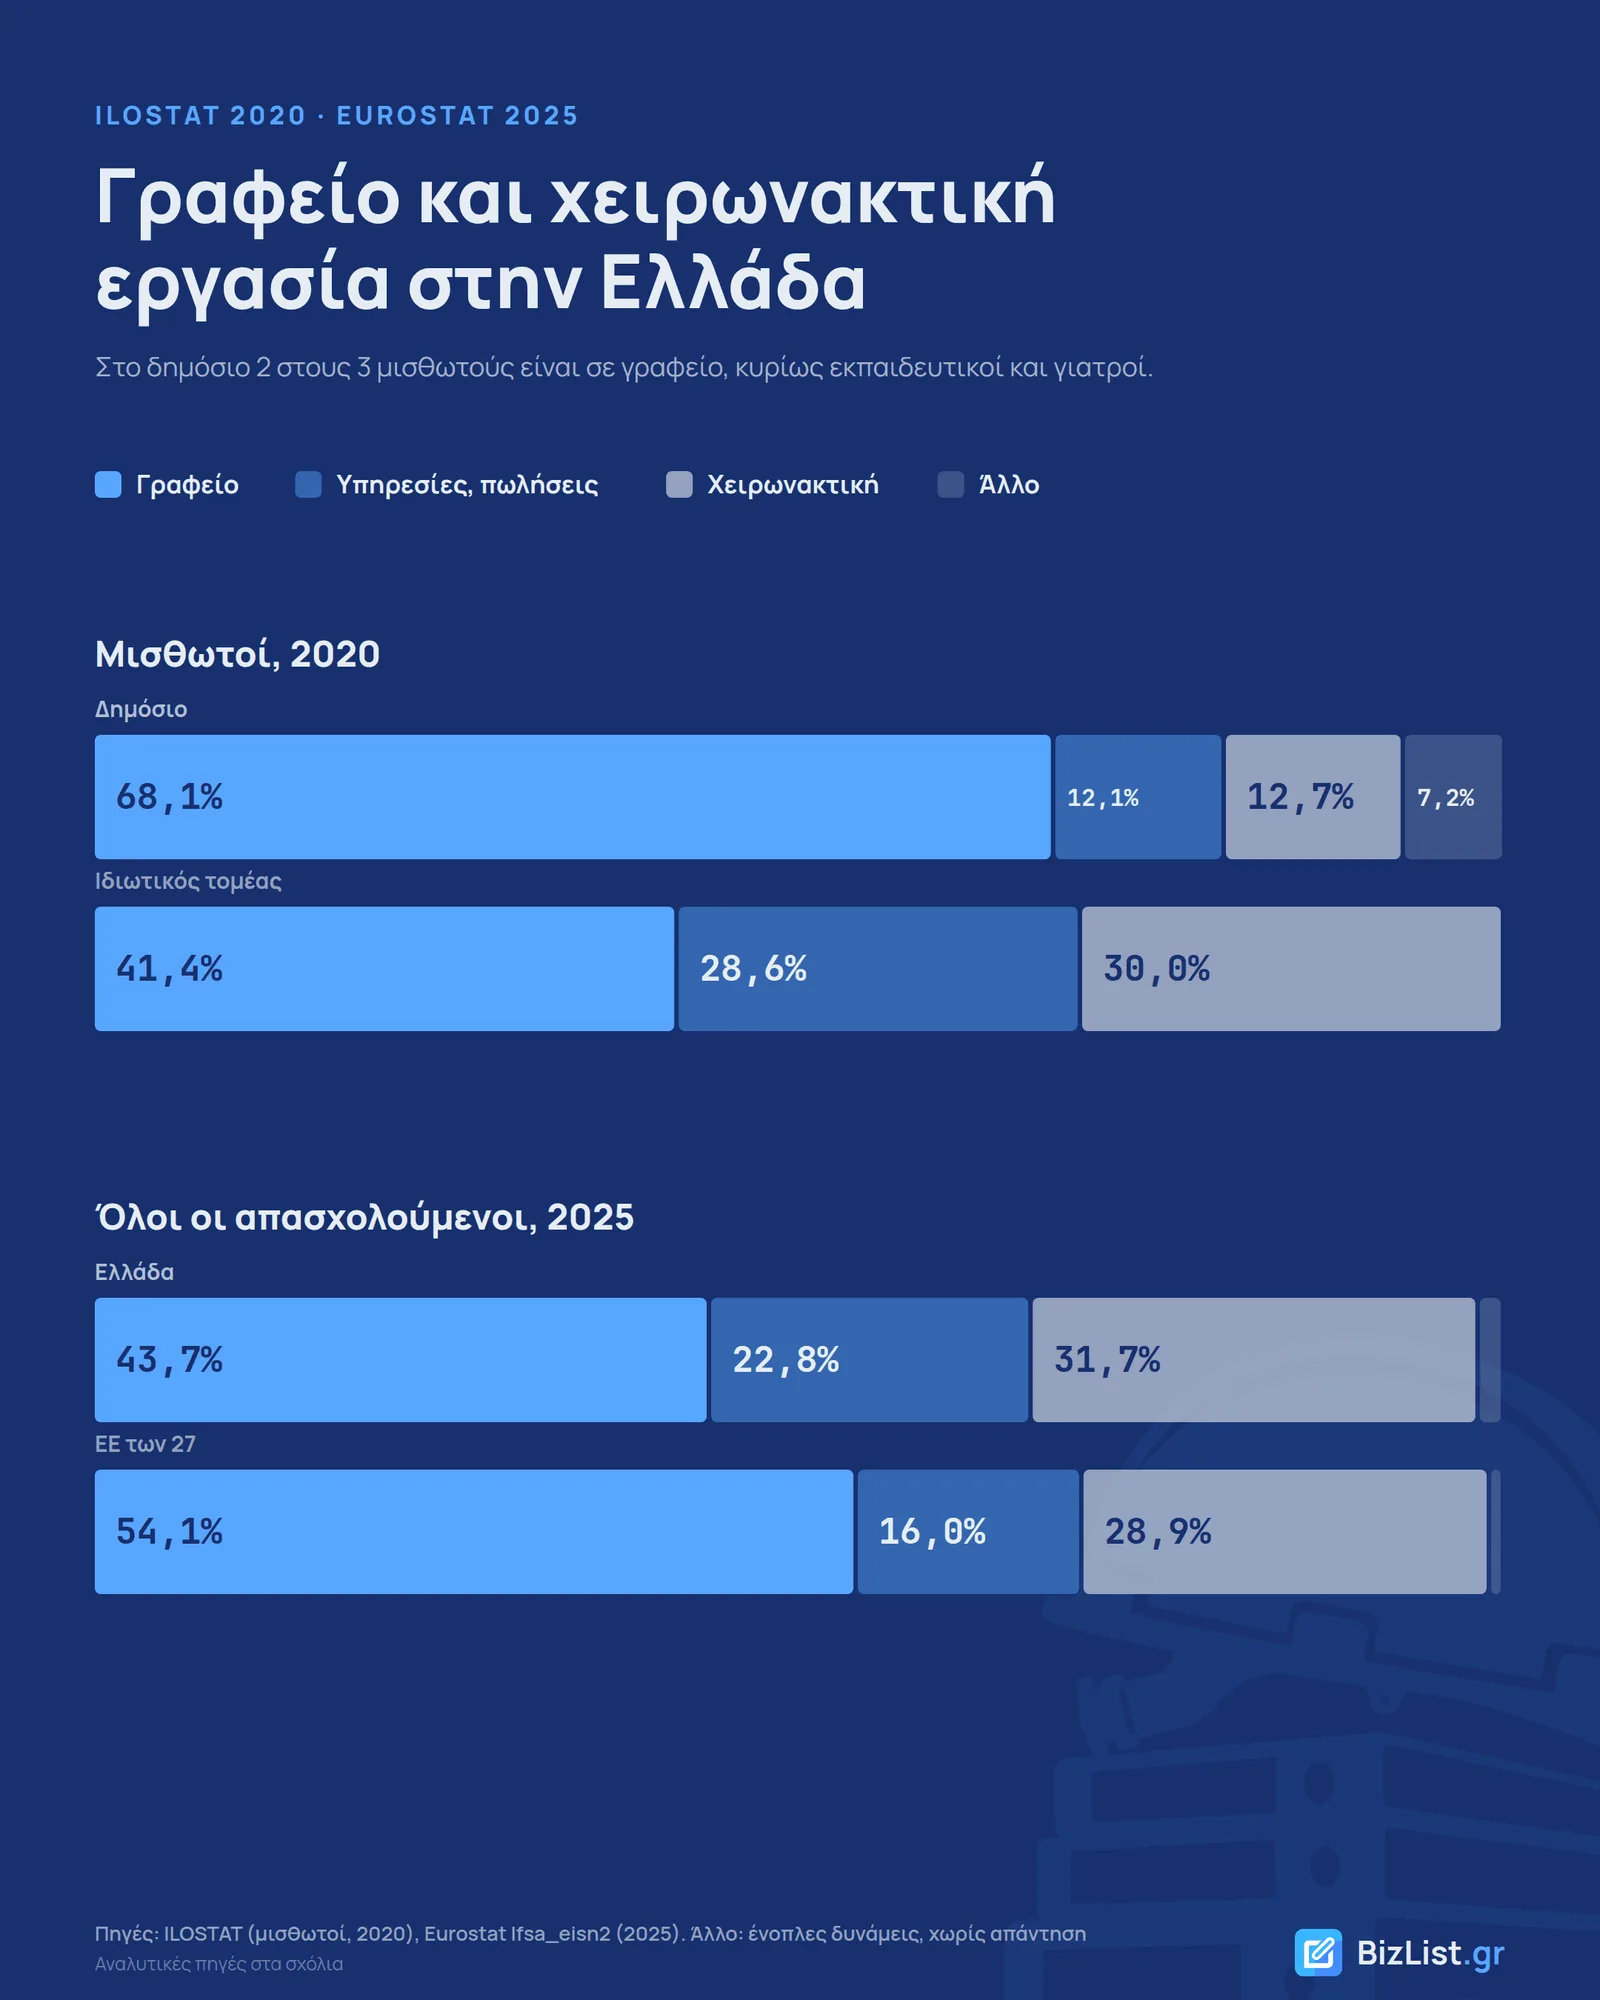
In Greece in 2025, 43.7% of the employed worked in office jobs and 31.7% did manual work. Among public sector employees, office jobs are 68.1%; among private sector employees, 41.4% (2020). In office jobs Greece ranks 26th of the 27 EU countries, and in technicians and associate professionals it is last.
From the Eurostat Labour Force Survey I took the table of occupation by industry for Greece, the EU average and the 27 member states: 78,359 values from 2008 to 2025. The split between public and private sector I took from the International Labour Organization (ILO), which produces it from the same microdata.
What counts as an office job
Eurostat classifies each employed person into one of the ten major occupation groups of the ISCO-08 classification. I split them into three:
| ISCO group | who they are | here |
|---|---|---|
| 1-4 | managers, professionals, technicians and associate professionals, clerical support workers | office |
| 5 | sales workers, waiters, hairdressers, care workers, police officers, firefighters | services and sales |
| 6-9 | farmers, craft workers, machine operators, elementary workers | manual |
Group 5 stays separate, because the cashier and the waiter work on their feet with customers and do not fit cleanly into either end. The armed forces (group 0) stay outside the groups.
Public and private sector
The Labour Force Survey asks each employee whether they work in the public or the private sector. ELSTAT, the Hellenic Statistical Authority, does not publish a table of occupation by sector. The International Labour Organization does, up to 2020. It counts only employees: the self-employed, among them most farmers, are not included.
| 2020, employees | public | private |
|---|---|---|
| Office (ISCO 1-4) | 68.1% | 41.4% |
| Services and sales (ISCO 5) | 12.1% | 28.6% |
| Manual (ISCO 6-9) | 12.7% | 30.0% |
| Professionals (ISCO 2) | 38.3% | 13.8% |
| Clerical support workers (ISCO 4) | 16.2% | 16.0% |
| Employees | 795,692 | 1,659,200 |
In the Greek public sector almost two in five employees are professionals: teachers, doctors, engineers. Clerical support workers are 16.2% in the public sector and 16.0% in the private sector, so the gap in office jobs is almost entirely in the professionals. In the private sector the largest group is sales workers, waiters and other service workers, 28.6%. The 7.2% of the public sector that is missing to reach 100% are employees with no occupation classification, which is where the armed forces go.
| year | public | private |
|---|---|---|
| 2011 | 70.2% | 35.2% |
| 2012 | 68.3% | 38.2% |
| 2013 | 67.8% | 39.0% |
| 2014 | 68.2% | 36.5% |
| 2015 | 68.7% | 37.0% |
| 2016 | 68.0% | 38.3% |
| 2017 | 67.1% | 38.9% |
| 2018 | 67.0% | 39.1% |
| 2019 | 67.4% | 38.4% |
| 2020 | 68.1% | 41.4% |
From 2011 to 2020 the public sector stayed between 67.0% and 70.2% in office jobs. The private sector rose from 35.2% in 2011 to 38.4% in 2019 and to 41.4% in 2020, the year of the pandemic. Its manual work fell from 39.3% to 32.2% by 2019 and to 30.0% in 2020. ILOSTAT has no later year for Greece, so we cannot see whether the jump of 2020 stayed.
Of the EU countries, ILOSTAT has the same table for only five others. The comparison is with them, without an EU average:
| 2020, employees | office, public | office, private | manual, public | manual, private |
|---|---|---|---|---|
| Greece | 68.1% | 41.4% | 12.7% | 30.0% |
| Spain | 69.6% | 39.2% | 9.6% | 39.6% |
| France | 66.7% | 53.5% | 14.4% | 30.7% |
| Austria | 68.7% | 52.3% | 14.2% | 29.8% |
| Poland | 73.8% | 41.2% | 16.2% | 42.4% |
| Slovakia | 61.5% | 39.5% | 18.9% | 43.0% |
The public sector has 61.5% to 73.8% office jobs in all six countries. The Greek private sector is close to Spain, Poland and Slovakia in office jobs, but it has less manual work than they do. Services take its place: 28.6% of its employees, when in the other five countries it is 15.3% to 21.2%.
Where the manual work is
1,373,300 people in Greece do manual work, 31.7% of the employed. The four industries with the most, agriculture, manufacturing, construction and trade, have 951,000 of them, almost 7 in 10.
| industry | employed |
|---|---|
| Agriculture, livestock, fishing | 388,600 |
| Manufacturing | 258,000 |
| Construction | 176,400 |
| Trade | 128,000 |
| Transport | 116,400 |
| Accommodation, food service | 97,100 |
| Public administration, defence | 39,100 |
| Administrative services | 33,800 |
| Professional, scientific | 20,100 |
| Health, social work | 18,200 |
| Education | 16,300 |
| Other services | 15,900 |
| IT, communications | 7,600 |
In construction manual work is 87.8% (EU 69.0%) and in manufacturing 61.1% (EU 54.3%). Around the building site and the production line there are fewer engineers, technicians and clerks: office jobs are 11.9% in construction and 27.1% in manufacturing, when in the EU they are 30.0% and 43.0%.
| 2025 | employed | office | office in the EU | manual | manual in the EU |
|---|---|---|---|---|---|
| Trade | 759,100 | 21.2% | 37.2% | 16.9% | 21.4% |
| Manufacturing | 422,600 | 27.1% | 43.0% | 61.1% | 54.3% |
| Accommodation, food service | 400,300 | 19.2% | 22.7% | 24.3% | 20.2% |
| Agriculture, livestock, fishing | 399,900 | 1.8% | 9.8% | 97.2% | 88.2% |
| Public administration, defence | 355,700 | 49.5% | 68.2% | 11.0% | 8.9% |
| Education | 335,800 | 93.1% | 84.9% | 4.9% | 5.6% |
| Professional, scientific | 314,500 | 92.8% | 94.8% | 6.4% | 3.7% |
| Health, social work | 302,200 | 85.1% | 68.8% | 6.0% | 8.0% |
| Transport | 235,500 | 43.1% | 40.0% | 49.4% | 55.4% |
| Construction | 200,800 | 11.9% | 30.0% | 87.8% | 69.0% |
| Administrative services | 113,100 | 46.9% | 36.3% | 29.9% | 45.4% |
| IT, communications | 112,900 | 86.2% | 94.4% | 6.7% | 3.7% |
| Other services | 92,000 | 24.2% | 38.9% | 17.3% | 15.6% |
Greece next to the EU
Across the whole economy Greece has 43.7% office jobs, against 54.1% in the EU. Only Romania is lower.
| country | office |
|---|---|
| Netherlands | 64.6% |
| Sweden | 63.0% |
| Belgium | 62.5% |
| Germany | 60.2% |
| France | 58.5% |
| Luxembourg | 57.4% |
| Ireland | 56.7% |
| Denmark | 55.8% |
| Austria | 55.5% |
| Malta | 54.6% |
| Lithuania | 54.4% |
| EU-27 | 54.1% |
| Poland | 52.7% |
| Cyprus | 52.0% |
| Finland | 51.9% |
| Croatia | 51.8% |
| Czechia | 50.2% |
| Portugal | 50.2% |
| Slovakia | 49.5% |
| Slovenia | 49.4% |
| Italy | 49.2% |
| Hungary | 49.0% |
| Latvia | 47.9% |
| Estonia | 47.8% |
| Spain | 46.6% |
| Bulgaria | 46.0% |
| Greece | 43.7% |
| Romania | 32.6% |
Professionals are 22.5% in Greece and 23.3% in the EU. The gap comes from the other groups:
| 2025, all industries | Greece | EU-27 |
|---|---|---|
| Technicians and associate professionals (ISCO 3) | 6.9% | 16.0% |
| Services and sales (ISCO 5) | 22.8% | 16.0% |
| Farmers, livestock farmers, fishers (ISCO 6) | 8.1% | 2.5% |
| Craft workers, operators, elementary workers (ISCO 7-9) | 23.6% | 26.5% |
| Employment in manufacturing | 9.7% | 15.2% |
| Employment in trade | 17.5% | 13.4% |
| Employment in accommodation and food service | 9.2% | 4.9% |
| Employment in agriculture | 9.2% | 3.2% |
Greece has the smallest share of technicians and associate professionals of the 27, and the largest in services and sales and in farmers. Food service and accommodation employ almost twice the EU share, agriculture almost three times. Four in five people employed in agriculture work for themselves, as shown in the analysis of the self-employed by industry. Craft workers, machine operators and elementary workers are fewer than the European average.
From the crisis to 2025
The number of employed by industry does not depend on the occupation classification, so the crisis can be measured without the break of 2011. From 2008 to 2013 Greece lost 1,097,100 jobs, from 4,610,300 to 3,513,200. Construction fell from 397,300 to 162,300 and manufacturing from 545,000 to 324,700.
In occupations the crisis shows from 2011. From 2011 to 2013, 246,900 manual jobs and 146,000 office jobs were lost. From 2013 to 2019 manual work stayed around 1.23-1.29 million, fell to 1,211,900 in 2020 and from 2021 rose again to 1,373,300. Office jobs outnumber manual jobs over the whole series, and from 2021 they rose by 201,700, to 1,893,100.
| year | office | services, sales | manual |
|---|---|---|---|
| 2011 | 1,612,200 | 862,700 | 1,484,600 |
| 2012 | 1,511,000 | 784,300 | 1,317,200 |
| 2013 | 1,466,200 | 718,600 | 1,237,700 |
| 2014 | 1,417,900 | 774,900 | 1,261,100 |
| 2015 | 1,445,600 | 850,100 | 1,230,600 |
| 2016 | 1,478,600 | 868,900 | 1,236,700 |
| 2017 | 1,507,300 | 879,700 | 1,275,500 |
| 2018 | 1,553,100 | 892,600 | 1,292,900 |
| 2019 | 1,616,400 | 915,900 | 1,294,000 |
| 2020 | 1,675,200 | 902,600 | 1,211,900 |
| 2021 | 1,691,400 | 865,500 | 1,282,900 |
| 2022 | 1,784,500 | 902,800 | 1,351,900 |
| 2023 | 1,778,100 | 927,800 | 1,394,400 |
| 2024 | 1,810,100 | 971,100 | 1,407,300 |
| 2025 | 1,893,100 | 987,000 | 1,373,300 |
As a share, the gap with the EU does not close. Up to 2020 Greece rose from 39.8% to 43.2% office jobs, as much as the EU (47.9% to 51.4%). From 2021, after the series break, Greece went only from 43.1% to 43.7% and the EU from 52.5% to 54.1%, so the gap grew from 9.4 to 10.4 points.
| year | Greece | EU-27 |
|---|---|---|
| 2011 | 39.8% | 47.9% |
| 2012 | 40.9% | 48.5% |
| 2013 | 41.7% | 48.8% |
| 2014 | 40.1% | 49.0% |
| 2015 | 40.0% | 49.2% |
| 2016 | 40.2% | 49.6% |
| 2017 | 40.2% | 49.8% |
| 2018 | 40.6% | 50.1% |
| 2019 | 41.3% | 50.7% |
| 2020 | 43.2% | 51.4% |
| 2021 | 43.1% | 52.5% |
| 2022 | 43.1% | 52.6% |
| 2023 | 42.4% | 53.0% |
| 2024 | 42.4% | 53.7% |
| 2025 | 43.7% | 54.1% |
Methodology
The source is the Eurostat table lfsa_eisn2, Labour Force Survey, employed aged 15 and over in
thousands, by ISCO-08 major group and NACE Rev. 2 industry. Last Eurostat update 10 September
2026, retrieved 4 October 2026. Public and private sector: ILOSTAT
DF_EES_TEES_SEX_OCU_INS_NB, employees, retrieved 5 October 2026. The sector is the one the
employee reports, and each country defines it a little differently, so the comparison of the six
countries is indicative. In Greece 7.2% of public sector employees have no occupation
classification, while in the other five that code is almost empty, so the Greek public sector
looks a little lower in office jobs. ILOSTAT does not have Greece after 2020.
In health, professionals are 63.0% of the employed, against 33.4% in the EU, and technicians together with personal care workers 17.2%, against 50.3%. I did not check which group nurses are classified in. If they go into professionals, the low position in technicians is partly a matter of classification.
I started the series in 2008 and cut it at 2011. That is the year ISCO-08 comes in, and managers outside public administration, education and health fall in one year from 422,500 to 156,700, while services and sales rise from 543,800 to 762,500. 266,000 people did not suddenly change jobs. The owner of a small shop who sells in person moved from managers to the shopkeepers of group 5. Eurostat also marks a break in 2021, with the new survey regulation, which is why changes are measured separately before and after.
The armed forces stay in the denominator. The 5,000 employed who did not report an industry are left out. Some small cells carry a low-reliability flag from Eurostat, none of the totals in this article. Eurostat does not publish very small cells at all, which is why mining, energy, water supply, finance, real estate and the arts are not in the table by industry. In agriculture, education and IT one or two cells of manual work are below the limit, so their number is a little lower than the real one.
Frequently asked questions
What share of workers in Greece work in an office?
How many work in an office in the public and in the private sector in Greece?
How does Greece compare with the EU?
Does Greece have more manual workers than the EU?
Sources
- Eurostat, Labour Force Survey: lfsa_eisn2, employed by ISCO-08 occupation and NACE Rev. 2 industry, 2008-2025 accessed 4 Οκτωβρίου 2026
- ILOSTAT, employees by occupation and public/private sector (DF_EES_TEES_SEX_OCU_INS_NB), 2011-2020 accessed 5 Οκτωβρίου 2026
- ILO, International Standard Classification of Occupations (ISCO-08) accessed 4 Οκτωβρίου 2026
Data snapshot taken on 4 Οκτωβρίου 2026.
The bizlist.gr analyses are information drawn from public data and do not constitute tax, accounting, legal or financial advice.
Try it yourself
The same filters used in this analysis, ready to run.
A full study of your industry?
Companies, revenue, profit and the largest players in your industry, across Greece. Free for subscribers.