Average hourly wage in Greece by sector, 2008-2026
The average gross hourly wage in Greek businesses was €15.3 in 2025, 58.2% of the EU average. In real terms it is 4.7% below 2008, it has risen 15.4% since 2020, and in the second quarter of 2026 it rose 1.3% above inflation.
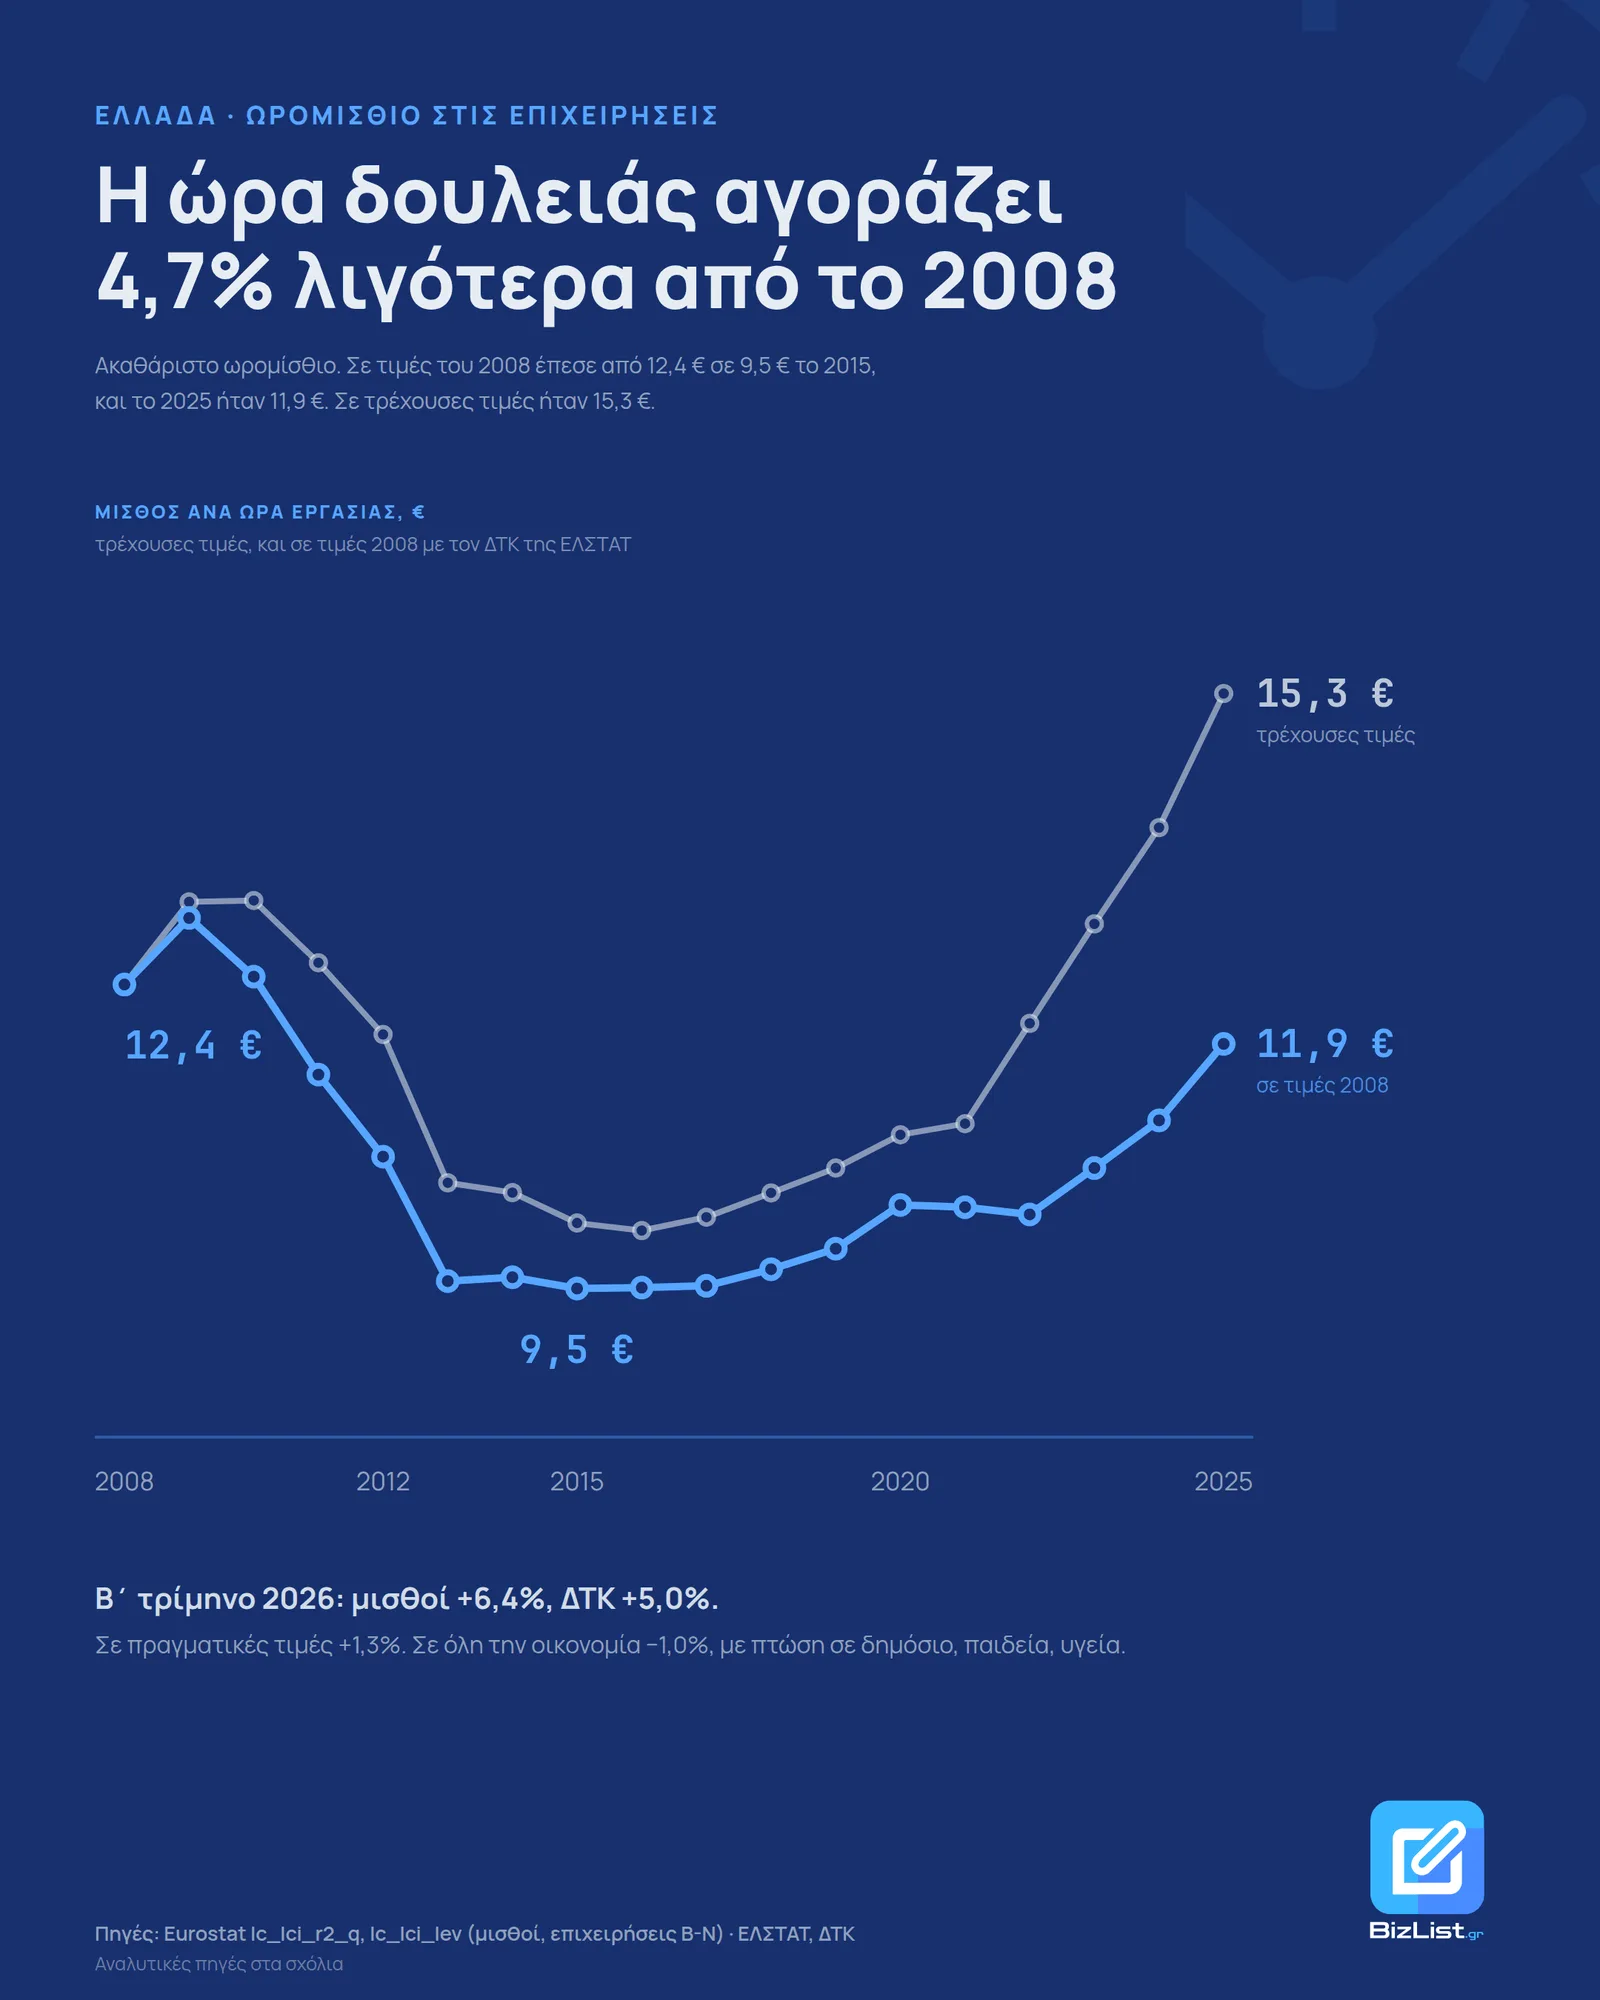
The average gross hourly wage in Greek businesses was €15.3 in 2025. In real terms it is still 4.7% below 2008, although it has risen 15.4% since 2020. In the second quarter of 2026, in businesses, it rose 1.3% above inflation. Across the whole economy it lost 1.0%, because in the public sector, education and health the hourly wage fell even in nominal terms.
I downloaded the quarterly Eurostat labour cost index for 26 sectors and groups of sectors, 106 quarters since 2000, and deflated it with the consumer price index (CPI) of ELSTAT, the Hellenic Statistical Authority. The amounts in euros come from the labour cost levels of the same agency, which also give the comparison with the other member states.
An hour of work in real terms
The first line is the gross wage per hour for each year, in current prices. The second is the same amount in 2008 prices, so what an hour of work buys at the prices of that year. It covers the business economy: industry, construction, trade and market services, without the public sector, education and health.
| year | current prices | in 2008 prices |
|---|---|---|
| 2008 | 12.44 | 12.44 |
| 2009 | 13.26 | 13.1 |
| 2010 | 13.27 | 12.52 |
| 2011 | 12.66 | 11.56 |
| 2012 | 11.95 | 10.75 |
| 2013 | 10.5 | 9.53 |
| 2014 | 10.4 | 9.57 |
| 2015 | 10.1 | 9.46 |
| 2016 | 10.03 | 9.47 |
| 2017 | 10.16 | 9.48 |
| 2018 | 10.4 | 9.65 |
| 2019 | 10.64 | 9.85 |
| 2020 | 10.97 | 10.28 |
| 2021 | 11.08 | 10.26 |
| 2022 | 12.06 | 10.19 |
| 2023 | 13.04 | 10.64 |
| 2024 | 13.98 | 11.11 |
| 2025 | 15.3 | 11.86 |
In 2008 prices, an hour of work reached €13.1 in 2009. From 2010 it fell every year, and in 2013 it was at €9.5. It stayed there for six years, between €9.5 and €9.6, with the bottom in 2015.
The rise started in 2018 and stopped in 2021 and 2022. In those years the CPI ran faster than wages: in the second quarter of 2022, wages across the whole economy rose 2.6% and prices 11.20%.
Since 2023 it has risen fast, €10.6 and €11.1 and €11.9 in 2025. That is 25.4% above the bottom, and €0.6 is still missing, or 4.7%, to reach the €12.4 of 2008. In current prices the hourly wage went from €12.4 in 2008 to €15.3 in 2025, while the CPI rose 29.0% in the same period.
The second quarter of 2026
On 14 September 2026, ELSTAT announced that the labour cost index for the second quarter was 4.0% above the second quarter of 2025. The CPI in the same months was 5.02% higher. Across the whole economy, an hour of work lost 1.0% in real terms, for the first time since the third quarter of 2024.
The release covers the whole economy except the primary sector, including the public sector.
| quarter | wage change | real change |
|---|---|---|
| Jan-Mar 2024 | +7.5% | +4.3% |
| Apr-Jun 2024 | +8.6% | +5.9% |
| Jul-Sep 2024 | +1.0% | −1.8% |
| Oct-Dec 2024 | +5.2% | +2.7% |
| Jan-Mar 2025 | +5.9% | +3.3% |
| Apr-Jun 2025 | +10.3% | +7.7% |
| Jul-Sep 2025 | +8.1% | +5.3% |
| Oct-Dec 2025 | +8.3% | +5.8% |
| Jan-Mar 2026 | +6.4% | +3.3% |
| Apr-Jun 2026 | +4.0% | −1.0% |
Each row compares with the same quarter of the previous year, because the index has no seasonal adjustment, and in the fourth quarter the Christmas bonus and allowances are paid. The +4.0% is measured on top of the +10.3% of the second quarter of 2025, the largest increase in the table.
On 16 September, Eurostat published the same index by sector. In businesses, wages rose 6.4%, which is 1.3% above inflation. The drop in the total comes from public administration, education and health.
| sector, second quarter 2026 | wage change | real change |
|---|---|---|
| Real estate | +12.4% | +7.0% |
| Construction | +9.7% | +4.4% |
| Accommodation, food service | +7.9% | +2.7% |
| Water supply, waste | +7.8% | +2.6% |
| Trade | +7.2% | +2.0% |
| Finance | +6.8% | +1.7% |
| Manufacturing | +6.7% | +1.6% |
| IT, communications | +5.7% | +0.6% |
| Transport | +5.3% | +0.3% |
| Professional, scientific | +4.1% | −0.8% |
| Energy | +4.0% | −1.0% |
| Administrative services | +2.2% | −2.7% |
| Mining | −5.0% | −9.5% |
| All businesses | +6.4% | +1.3% |
| Public administration | −1.6% | −6.3% |
| Education | −2.2% | −6.9% |
| Health, social work | −2.7% | −7.4% |
| Whole economy | +4.0% | −1.0% |
In the public sector the comparison is with a quarter that had a jump: in public administration, the index for the second quarter of 2025 was 12.2% above the year before. Over two years, since the second quarter of 2024, wages rose 10.3% in public administration, 6.8% in health and 1.5% in education. In businesses they rose 17.7%.
By sector, since 2020
| sector | €/hour 2025 | real change 2020-2025 | % of EU, 2025 |
|---|---|---|---|
| Accommodation, food service | €13.5 | +37.0% | not available |
| Transport | €22.6 | +27.3% | 98.3% |
| Professional, scientific | €17.7 | +25.7% | 47.7% |
| IT, communications | €21.0 | +21.7% | 56.8% |
| Administrative services | €11.5 | +20.9% | 57.5% |
| Finance | €26.9 | +11.2% | 62.3% |
| Construction | €11.4 | +8.8% | 48.3% |
| Energy | €17.4 | +6.1% | 48.2% |
| Trade | €12.7 | +6.0% | 56.4% |
| Manufacturing | €14.0 | +4.9% | 53.0% |
| Water supply, waste | €10.6 | +4.0% | 50.0% |
| Real estate | €13.2 | +0.2% | 48.9% |
| Mining | €13.8 | −0.9% | 53.3% |
| All businesses | €15.3 | +15.4% | 58.2% |
Accommodation and food service had the largest real rise, 37.0% in five years, and at €13.5 an hour they are still below the business average. Transport is the only sector that comes close to the EU, at 98.3%. In manufacturing the hour rose 4.9% and in trade 6.0%. Mining is the only sector with a real fall.
I started the comparison by sector from 2008 and dropped it. For the same period, the amounts in euros give food service +17.6% and the index −4.9%, professional activities +14.3% and −17.9%. The gap between the two methods reaches 32.2 points. From 2020 they are less than one point apart in every sector of the table, so the table starts there.
Compared with Europe
In 2024 Greece was 19th of the 27 member states, with €14.0 an hour, when the EU average was €25.2. Right above it is Croatia with €14.3, right below it Portugal with €13.8. I kept 2024 because Belgium is still missing for 2025.
| country | € per hour |
|---|---|
| Luxembourg | €47.3 |
| Denmark | €45.2 |
| Belgium | €35.4 |
| Germany | €34.1 |
| Ireland | €33.9 |
| Netherlands | €33.5 |
| Finland | €32.4 |
| Austria | €32.1 |
| France | €30.3 |
| Sweden | €29.6 |
| EU-27 | €25.2 |
| Slovenia | €23.9 |
| Italy | €21.7 |
| Spain | €18.4 |
| Malta | €16.3 |
| Cyprus | €15.9 |
| Lithuania | €15.4 |
| Estonia | €14.5 |
| Croatia | €14.3 |
| Greece | €14.0 |
| Portugal | €13.8 |
| Czechia | €13.7 |
| Poland | €13.6 |
| Slovakia | €13.3 |
| Latvia | €12.3 |
| Hungary | €12.3 |
| Romania | €11.6 |
| Bulgaria | €9.2 |
The comparison in euros does not account for the lower prices in Greece. The price level of consumption was 83.0% of the EU average in 2024, and with this correction the Greek hourly wage reaches 66.9% of the European one. In 2008 it was 78.8% in euros and 85.0% with the correction. In the Eurostat levels, from 2008 to 2025 the hourly wage rose 21.4% in nominal terms in Greece and 64.4% in the EU.
Methodology
Sources: Eurostat lc_lci_r2_q for the index (2020 = 100, no seasonal adjustment), lc_lci_lev for euros per hour and prc_ppp_ind for the price level of actual individual consumption, the ELSTAT CPI, and the release of 14/09/2026 for the second quarter. Retrieved on 17 September 2026. The Eurostat index is the same as the ELSTAT one: 130.7 in the second quarter of 2025, 117.7 in the first quarter of 2026 and 135.9 in the second quarter of 2026 in both sources.
The measure is the D11 series, gross wages per hour actually worked, including bonuses, allowances and overtime, without employer social contributions. The business economy is NACE sections B to N. With the whole economy included, with the public sector, education and health, 2025 comes out 12.9% below 2008 in real terms, instead of 4.7%. The annual index is the average of the four quarters. For all businesses, the amounts in euros give −5.9% since 2008 and the index −4.7%, and in the text I kept the index. That is why the amounts in the first chart start from the €15.3 of 2025 and go back with the index: 2008 comes out at €12.4, while in the Eurostat levels it is €12.6. From 2020 onward the two agree.
The quarterly ELSTAT index covers businesses with at least 5 employees, and the Eurostat amounts cover units with at least 10 employees. The smaller businesses, the self-employed and undeclared work stay out. If small businesses pay less per hour, the average hourly wage of all employees is lower than €15.3. The index is also an average over jobs: if the mix of jobs inside a sector changes, the index changes without any wage changing.
Frequently asked questions
What is the average hourly wage in Greece?
Which sector in Greece has the highest hourly wage?
Have Greek wages returned to the 2008 level?
How does the Greek hourly wage compare with the EU?
Sources
- Eurostat, lc_lci_r2_q: labour cost index by NACE sector, quarterly, Greece accessed 17 Σεπτεμβρίου 2026
- Eurostat, lc_lci_lev: labour cost levels in euros per hour, EU-27 accessed 14 Σεπτεμβρίου 2026
- Eurostat, prc_ppp_ind: price levels, actual individual consumption accessed 14 Σεπτεμβρίου 2026
- ELSTAT (Hellenic Statistical Authority), Labour Cost Index, second quarter 2026, release of 14/09/2026 accessed 14 Σεπτεμβρίου 2026
- ELSTAT, Consumer Price Index, monthly series accessed 14 Σεπτεμβρίου 2026
Data snapshot taken on 16 Σεπτεμβρίου 2026.
The bizlist.gr analyses are information drawn from public data and do not constitute tax, accounting, legal or financial advice.
Try it yourself
The same filters used in this analysis, ready to run.
A full study of your industry?
Companies, revenue, profit and the largest players in your industry, across Greece. Free for subscribers.