Revenue of Greek accommodation runs four times faster than overnight stays
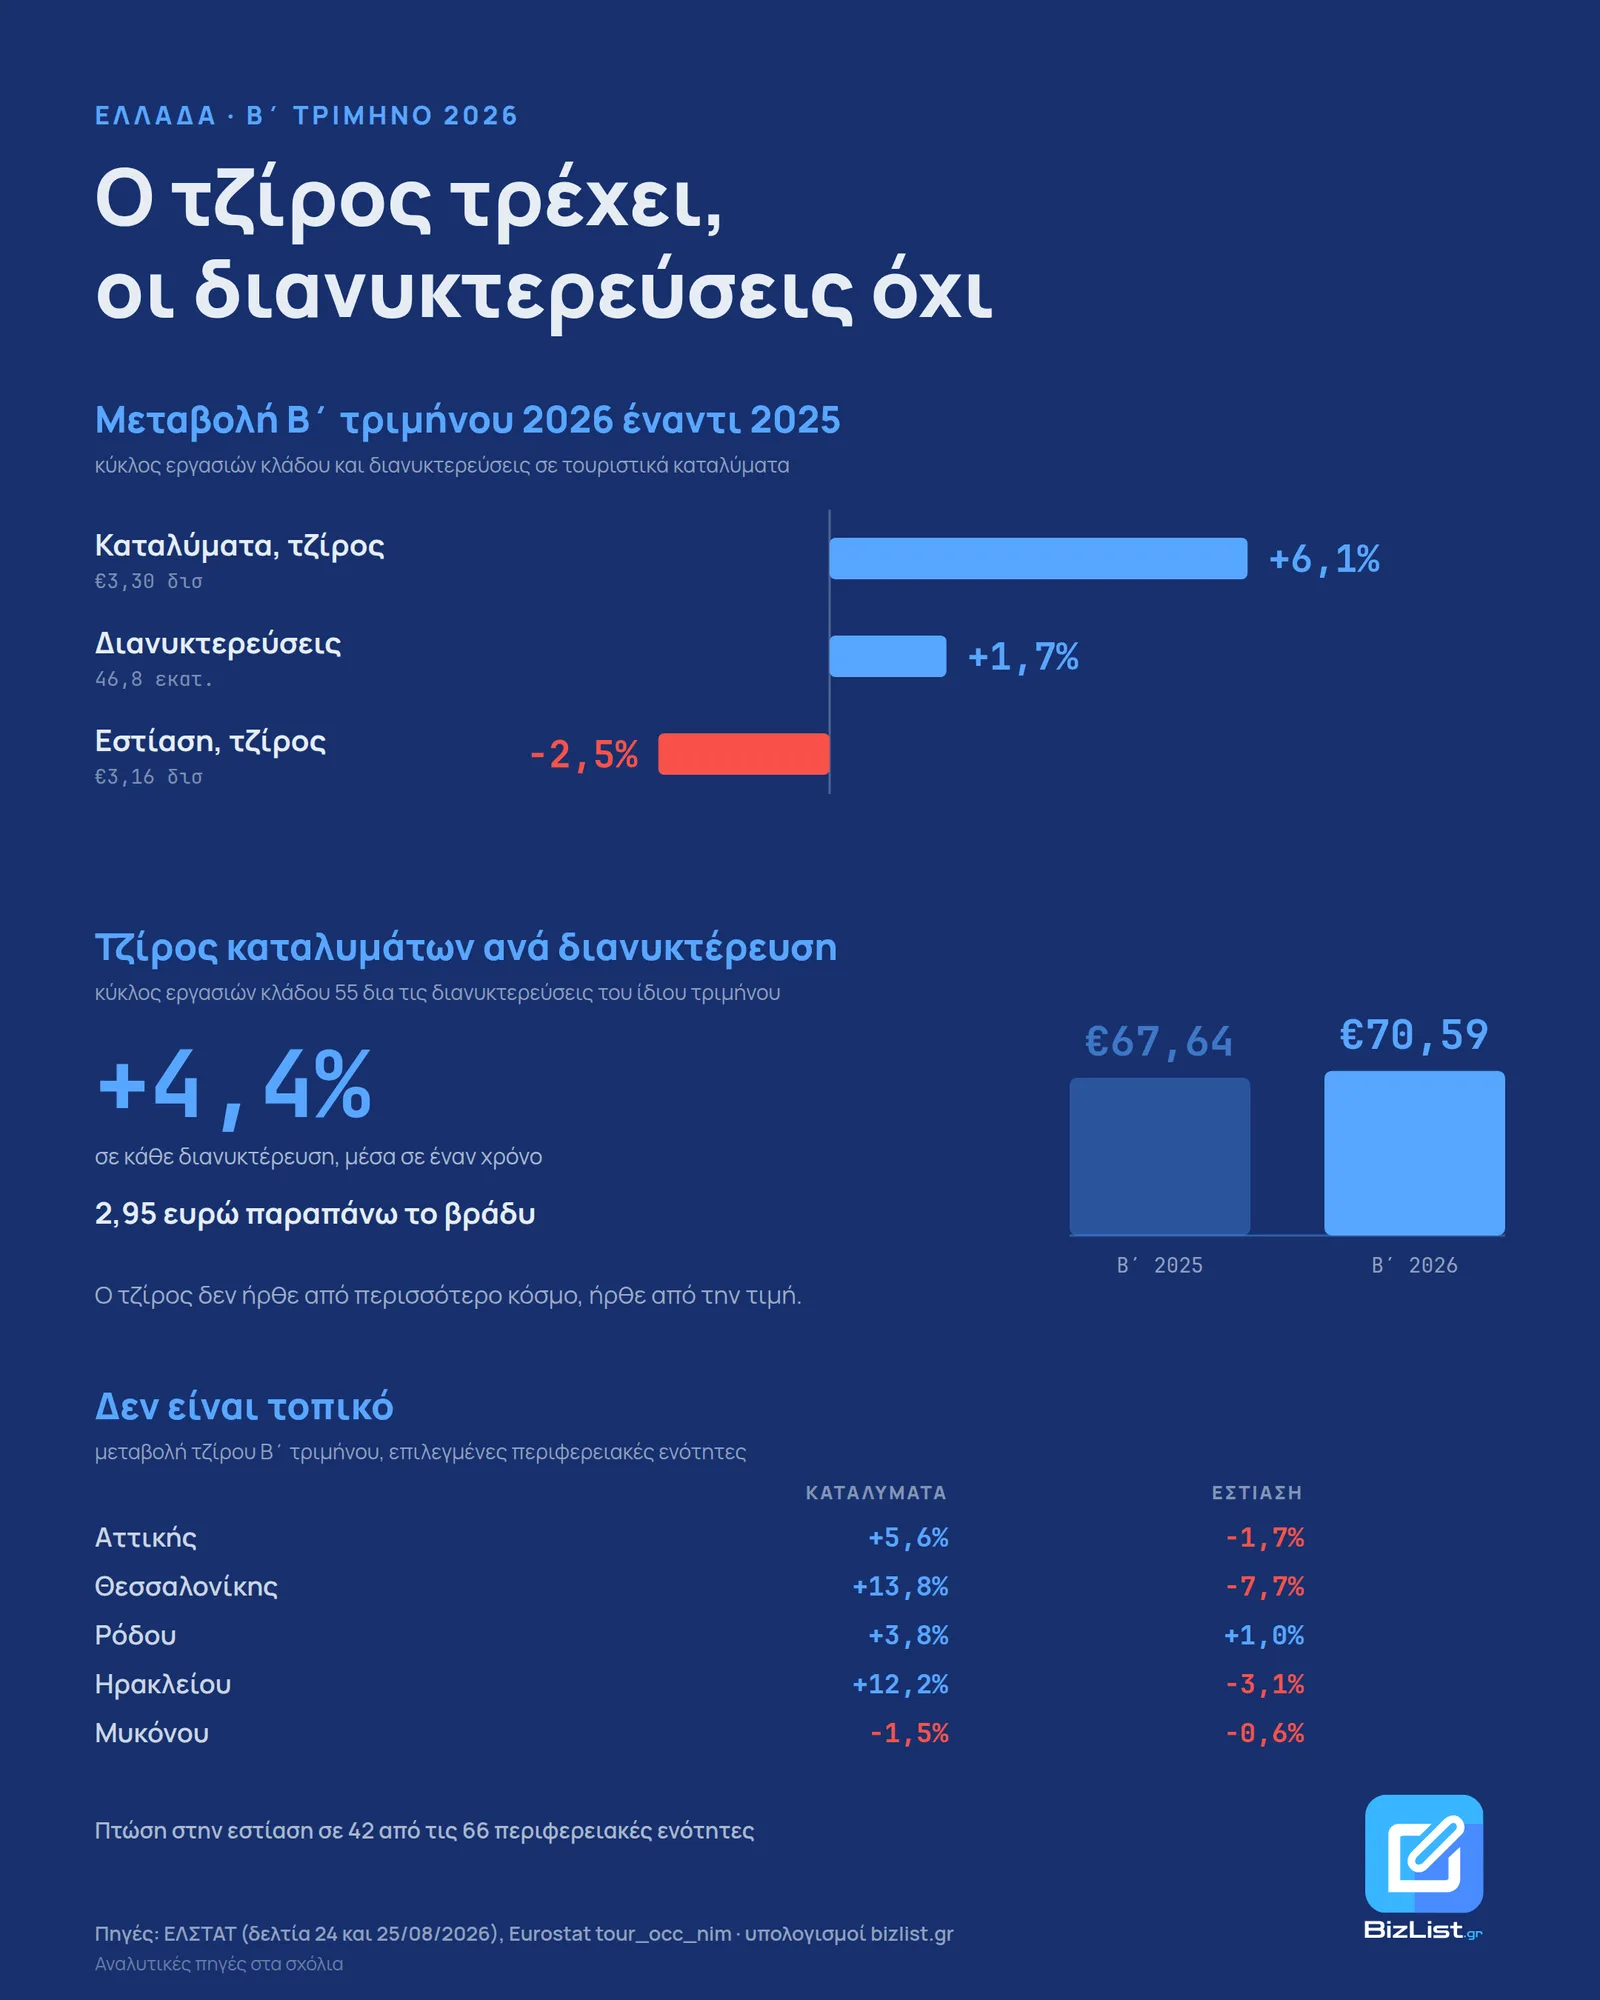
Second quarter of 2026 in Greece: accommodation revenue +6.1%, overnight stays +1.7%. The division gives €70.59 per overnight stay, up from €67.64 last year. At the same time food service revenue fell 2.5%.
ELSTAT, the Hellenic Statistical Authority, published two releases in two days. On 24 August it released overnight stays in Greece for June. On the 25th it released second-quarter revenue for accommodation and food service. Neither release divides one figure by the other.
The two figures for the quarter: accommodation revenue +6.1%, overnight stays +1.7%. The gap is the whole story.
Revenue per overnight stay
| quarter | per overnight stay |
|---|---|
| Apr-Jun 2025 | €67.64 |
| Apr-Jun 2026 | €70.59 |
Two euros and ninety-five cents more on every overnight stay, which is +4.4% in one year. The revenue did not come from more people.
The numerator is €3,303,871 thousand for the quarter. The denominator is 46,802,640 overnight stays. Last year the same figures were €3,112,772 thousand and 46,017,867.
How we built the quarter for overnight stays
The arrivals release is monthly. The revenue release is quarterly. To compare them in the same window we need April and May, which are no longer available as separate files on the ELSTAT site.
I took them from Eurostat, series tour_occ_nim. It is the same series: Eurostat's June 2025
gives 23,719,868 overnight stays, exactly the figure of the Greek release, down to the unit. June
2026 is not on Eurostat yet, so it comes from the release.
| month | 2025 | 2026 |
|---|---|---|
| April | 6,888,807 | 6,918,433 |
| May | 15,409,192 | 15,823,095 |
| June | 23,719,868 | 24,061,112 |
| Second quarter | 46,017,867 | 46,802,640 |
Almost all the increase comes from foreign visitors, +1.9%. Domestic visitors +0.6%.
At the same time, food service
| sector | Apr-Jun 2025 | Apr-Jun 2026 |
|---|---|---|
| Accommodation | 3.113 | 3.304 |
| Food service | 3.245 | 3.165 |
Food service revenue fell 2.5%, to €3.165 billion. This is the same quarter with more overnight stays, so there is no shortage of people. And in the second quarter of 2026 accommodation passes food service in revenue. This reverses last year's picture: in the second quarter of 2025 food service was ahead, €3.245 billion against €3.113 billion.
The fall is not local. In 42 of the 66 regional units of Greece, food service revenue is below last year, while accommodation rises in 48 of the 66.
| regional unit | accommodation | food service |
|---|---|---|
| Attica | +5.6% | −1.7% |
| Thessaloniki | +13.8% | −7.7% |
| Heraklion | +12.2% | −3.1% |
| Rhodes | +3.8% | +1.0% |
| Halkidiki | +2.0% | −7.3% |
| Achaea | +5.6% | −11.7% |
| Mykonos | −1.5% | −0.6% |
The accommodation sector and food service have 45,552 and 100,071 active businesses respectively. Attica, the region around Athens, holds 41.0% of food service revenue nationwide and 24.5% of accommodation. The geography follows the registered seat of the VAT number (Greek tax ID), so a chain based in Athens books its revenue in Attica.
What the registry shows
In GEMI, the General Commercial Registry, new registrations of food service businesses in the seven months from January to July:
| sector | 2024 | 2025 | 2026 | vs 2025 |
|---|---|---|---|---|
| Accommodation | 3,330 | 2,509 | 2,091 | −16.7% |
| Food service | 4,362 | 5,133 | 4,010 | −21.9% |
These are registrations, not closures. They say fewer newcomers are entering. To measure whether the sector is shrinking we would need to count deregistrations. The new food service companies of the last year are available with their names.
The 2024 financial statements
The sector that is losing revenue was already working at zero margin. Of the companies that file financial statements in GEMI, with a financial year that closed in 2024:
| Accommodation | Food service | |
|---|---|---|
| In the sample, with revenue and profit | 6,744 | 3,309 |
| Share of active businesses in the sector | 20.8% | 4.0% |
| Median profit margin | 7.6% | 0.7% |
| Mean margin | 2.3% | −8.3% |
| Total profit divided by total revenue | 11.9% | 4.6% |
| Loss-making | 36.4% | 47.4% |
| Margin above 10% | 45.2% | 22.7% |
| Median revenue | €182,203 | €286,384 |
The three margins say different things and are worth reading together. The median is the typical company. The mean is pulled down by large losses, which is why it is negative in food service. The aggregate stays positive because revenue is concentrated in the large companies, which make a profit.
Sample revenue is €9.33 billion in accommodation and €3.26 billion in food service, against annual sector revenue of €12.38 billion and €12.83 billion according to ELSTAT for 2025. So we capture 75% of accommodation and 25% of food service. This fits the fact that the large companies are the ones that file financial statements.
Methodology
The "per overnight stay" ratio is my own calculation, not a figure that ELSTAT publishes. The numerator is all the revenue of sector 55 (accommodation), so it includes the hotel restaurant, conferences and the spa. The denominator is overnight stays in hotels, campsites and registered rented rooms. It is not a room rate. The level of €70 does not compare with ADR (average daily rate). The change holds because the definition is the same in both years.
The denominator does not capture short-term rentals by private individuals. If these grow outside the sample, part of the +4.4% is a shift and not price.
ELSTAT changed the coverage this year in the revenue release. It added businesses founded in 2024 or 2025 with 2025 annual revenue of at least €500 thousand. Part of the +6.1% is better coverage, not growth. The release does not quantify how much.
The regional unit table is missing Imathia, which ELSTAT withholds as not comparable. That is why there are 66 units and not 67. The sum of the regional units matches the national total minus exactly Imathia, and this is the check that the table was parsed correctly.
In the financial statements, the margin is pre-tax, because after-tax profit is missing from a large part of the sample. In the common subset the difference is about 0.4 percentage points. The mean ignores 529 companies with a margin outside ±200%, otherwise they drag it to −11,400%. The median and the shares are calculated on the whole population. Branches of foreign companies and those that report in another currency are excluded.
New GEMI registrations are counted by today's main activity code (KAD, the Greek extension of NACE), so a company that changed its business after founding counts in its current sector.
Frequently asked questions
How much did hotel revenue in Greece grow in the second quarter of 2026?
Why is food service revenue in Greece falling while tourism grows?
Is €70.59 per overnight stay the room rate?
Sources
- ELSTAT (Hellenic Statistical Authority), revenue of accommodation and food service businesses, second quarter 2026 accessed 25 Αυγούστου 2026
- ELSTAT, arrivals and overnight stays in tourist accommodation, June 2026 accessed 25 Αυγούστου 2026
- Eurostat tour_occ_nim, overnight stays by month accessed 25 Αυγούστου 2026
- GEMI registry (Greece) and 2024 financial statements via bizlist.gr
Data snapshot taken on 25 Αυγούστου 2026.
The bizlist.gr analyses are information drawn from public data and do not constitute tax, accounting, legal or financial advice.
Try it yourself
The same filters used in this analysis, ready to run.
A full study of your industry?
Companies, revenue, profit and the largest players in your industry, across Greece. Free for subscribers.