What fish sells for at the boat in Greece, by species, 2025
ELSTAT gives quantity and value in adjacent columns. I divided them by species: €0.90 per kg for round sardinella, €50.39 for lobster, €3.96 on average in Greece. The thirteen cheapest species are half the tonnes of the year and one fifth of the money.
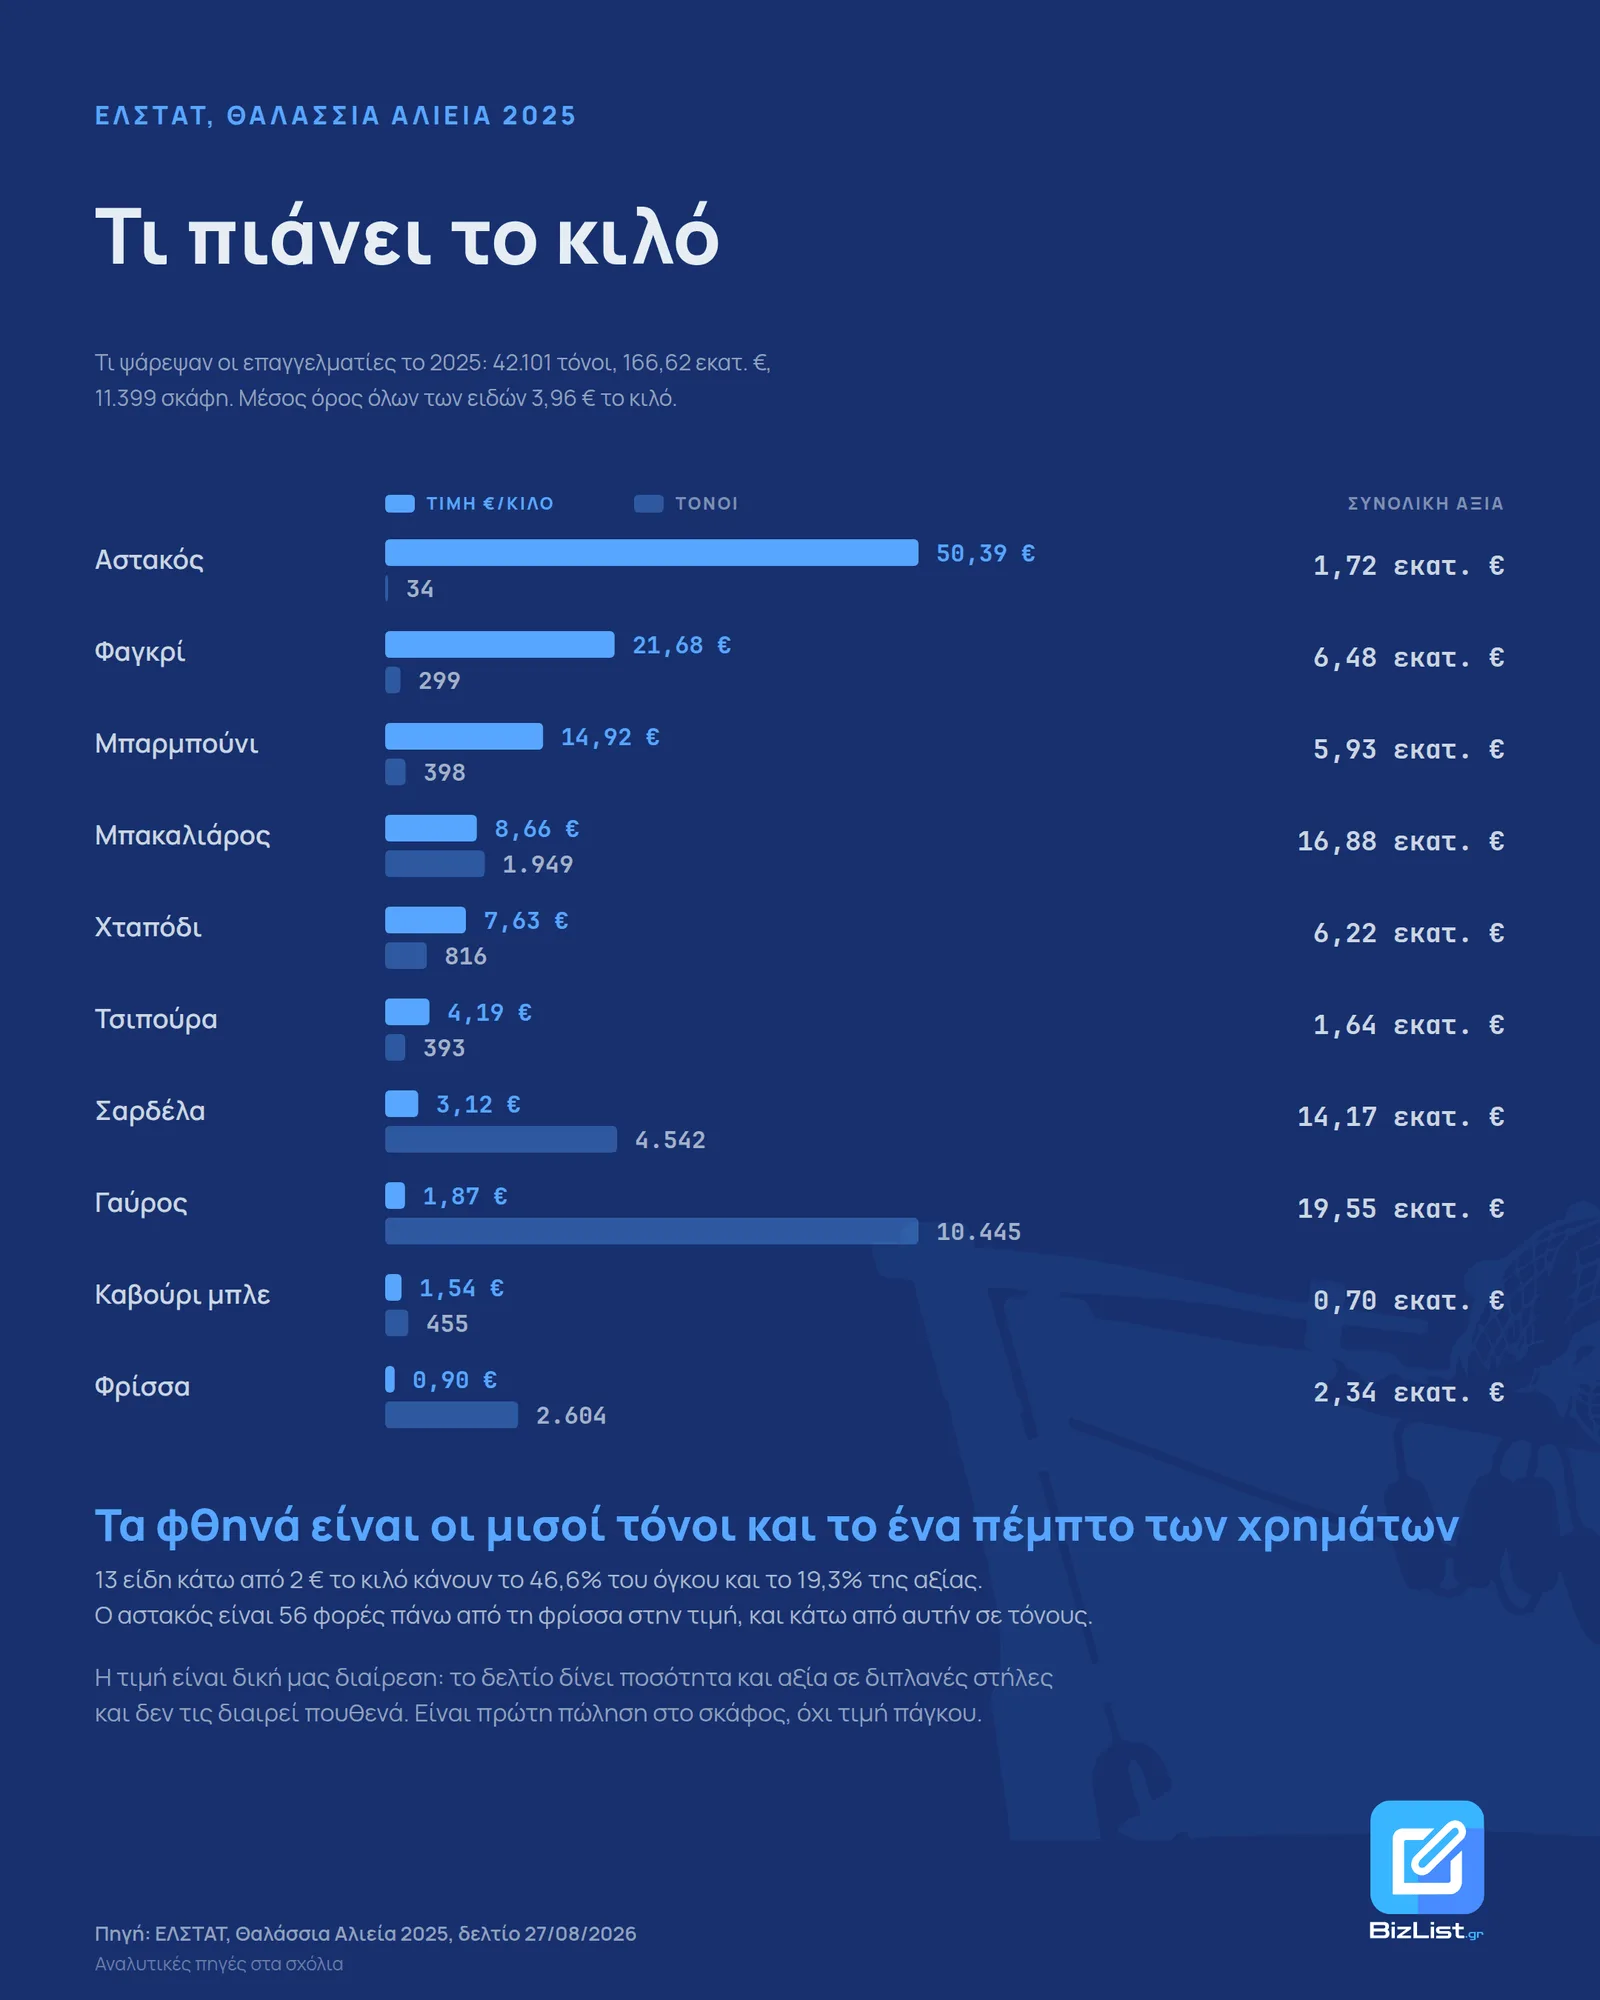
On 27 August 2026 ELSTAT, the Hellenic Statistical Authority, published the sea fisheries data for Greece in 2025: 42,100.8 tonnes of catch, €166.62 million in first-sale value, 11,399 motor-propelled vessels. The release gives quantity and value in adjacent columns and never divides them. I divided them by species. The average price at the boat comes out at €3.96 per kg, and by species it ranges from €0.90 to €50.39.
From €0.90 to €50.39
| species | price at the boat | tonnes | total value |
|---|---|---|---|
| Common spiny lobster | €50.39 | 34.1 | €1,718,400 |
| Common dentex | €22.09 | 136.6 | €3,018,000 |
| Red porgy | €21.68 | 299.1 | €6,483,000 |
| Warty venus | €17.01 | 41.2 | €700,900 |
| Red scorpionfish | €15.70 | 144.7 | €2,271,600 |
| Surmullet | €14.92 | 397.5 | €5,930,000 |
| Norway lobster | €13.16 | 214.9 | €2,829,100 |
| Greater amberjack | €11.95 | 434.7 | €5,193,300 |
| John dory | €11.69 | 130.6 | €1,526,800 |
| Inshore squids (all species) | €11.51 | 358.7 | €4,128,000 |
| White seabream | €9.92 | 160.9 | €1,595,900 |
| Swordfish | €9.23 | 198.7 | €1,834,200 |
| Red mullet | €8.72 | 1,066.8 | €9,300,500 |
| European hake | €8.66 | 1,949.2 | €16,879,400 |
| Bearded horse mussel | €8.16 | 288.8 | €2,357,800 |
| Common octopus | €7.63 | 816.2 | €6,224,600 |
| European seabass | €7.48 | 151.8 | €1,135,400 |
| Atlantic bluefin tuna | €6.62 | 358.5 | €2,372,200 |
| Common cuttlefish | €6.39 | 637.9 | €4,077,700 |
| Monkfish | €5.46 | 263.5 | €1,437,900 |
| Gilthead seabream | €4.19 | 392.7 | €1,644,600 |
| Mediterranean mussel | €4.07 | 36.4 | €148,000 |
| Deep-water rose shrimp or caramote prawn (DPS and TGS) | €3.98 | 2,067.5 | €8,236,700 |
| Miscellaneous aquatic animals | €3.91 | 397.1 | €1,552,600 |
| Atlantic bonito | €3.84 | 317.8 | €1,221,400 |
| Horned and musky octopuses | €3.79 | 233.4 | €884,400 |
| Saddled seabream | €3.16 | 265.6 | €838,500 |
| European pilchard (sardine) | €3.12 | 4,541.6 | €14,173,700 |
| Blue whiting | €2.89 | 292.2 | €843,500 |
| Common pandora | €2.78 | 496.5 | €1,381,400 |
| Albacore | €2.53 | 282.1 | €714,300 |
| Ommastrephid squids (all species) | €2.53 | 787.5 | €1,990,800 |
| Picarel | €2.48 | 681.3 | €1,692,800 |
| Atlantic chub mackerel | €1.92 | 1,090.5 | €2,090,300 |
| Salema | €1.90 | 140.0 | €265,300 |
| European anchovy | €1.87 | 10,445.1 | €19,553,600 |
| Spottail mantis shrimp | €1.79 | 372.7 | €666,700 |
| Flathead grey mullet | €1.79 | 555.7 | €993,400 |
| Raja rays | €1.69 | 328.1 | €555,100 |
| Blue crab | €1.54 | 454.7 | €702,100 |
| Little tunny | €1.43 | 589.5 | €845,300 |
| Bogue | €1.40 | 1,494.8 | €2,092,400 |
| Frigate and bullet tunas | €1.33 | 302.6 | €402,300 |
| Horse mackerels | €1.33 | 1,073.4 | €1,422,700 |
| Red-eye round herring | €1.00 | 173.0 | €173,600 |
| Round sardinella | €0.90 | 2,603.6 | €2,339,100 |
Lobster is paid fifty-six times more than round sardinella.
Volume and value do not move together
| price band | species | tonnes | % of volume | value | % of value |
|---|---|---|---|---|---|
| under €2 | 13 | 19,623.7 | 46.6% | €32,101,900 | 19.3% |
| €2 to €5 | 14 | 14,090.2 | 33.5% | €49,419,400 | 29.7% |
| €5 to €10 | 11 | 5,931.5 | 14.1% | €47,473,900 | 28.5% |
| €10 and over | 11 | 2,455.6 | 5.8% | €37,625,200 | 22.6% |
The thirteen cheapest species are almost half the tonnes of the year and one fifth of the money. The eleven most expensive are 5.8% of the tonnes and 22.6% of the value.
At the top by value, the ranking turns upside down compared with price:
Anchovy brings in more money than any other species, €19.55 million or 11.7% of the total value, at €1.87 per kg. Lobster brings €1.72 million from 34.1 tonnes. Anchovy has three hundred and six times the tonnes of lobster and eleven times its value.
Fish, crustaceans, molluscs
| group | tonnes | value | price at the boat |
|---|---|---|---|
| Fish | 35,057.1 | €126,318,200 | €3.60 |
| Crustaceans | 3,407.4 | €17,979,100 | €5.28 |
| Molluscs | 3,239.1 | €20,770,400 | €6.41 |
| Miscellaneous aquatic animals | 397.1 | €1,552,600 | €3.91 |
Fish are 83.3% of the tonnes and 75.8% of the value. Molluscs are 7.7% of the tonnes and 12.5% of the value, with the highest price per kg of the four groups.
The 450 vessels that catch three quarters
| fishing gear | vessels | tonnes | % of volume | value | % of value | price at the boat |
|---|---|---|---|---|---|---|
| Bottom otter trawlers | 231 | 10,750.1 | 25.5% | €54,581,700 | 32.8% | €5.08 |
| Purse seiners | 219 | 21,667.5 | 51.5% | €48,158,500 | 28.9% | €2.22 |
| Other inshore fishing | 10,949 | 9,683.2 | 23.0% | €63,880,100 | 38.3% | €6.60 |
Trawlers and purse seiners are 450 vessels, 3.9% of the fleet, and they catch 77.0% of the tonnes. Purse seiners alone catch more than half the tonnes in Greece, at €2.22 per kg, because they work on anchovy and sardine.
Inshore fishing is 96.1% of the vessels and brings 23.0% of the tonnes and 38.3% of the money, at the highest price per kg. Per vessel, however, the numbers spread widely: €5,834 a year for an inshore boat, €236,284 for a trawler, €219,902 for a purse seiner. This is first-sale income before any cost, and the denominator is the registered vessels, not the ones that worked all year.
Where the fish are caught
| fishing area | tonnes | % of volume | value | % of value | price at the boat |
|---|---|---|---|---|---|
| Northern Aegean | 28,452.9 | 67.6% | €101,017,000 | 60.6% | €3.55 |
| Southern Aegean | 9,183.2 | 21.8% | €43,147,900 | 25.9% | €4.70 |
| Central Ionian | 3,106.7 | 7.4% | €14,958,000 | 9.0% | €4.81 |
| Northern Ionian | 1,116.8 | 2.7% | €6,163,400 | 3.7% | €5.52 |
| Levant | 197.1 | 0.5% | €805,400 | 0.5% | €4.09 |
| Southern Ionian | 44.1 | 0.1% | €528,600 | 0.3% | €11.99 |
Two thirds of the catch comes from the Northern Aegean, at the lowest price per kg in Greece. The Southern Ionian has the highest price, €11.99, on 44.1 tonnes, which is one thousandth of the output.
The six areas are not official geographic units with published boundaries. ELSTAT built them by grouping statistical rectangles of the GFCM grid (General Fisheries Commission for the Mediterranean) inside the FAO subareas for the Ionian, the Aegean and the Levant, and did not publish which rectangle goes where. That is why the map puts circles at positions and not shaded areas.
The sea bream on the plate does not come from here
The 392.7 tonnes of gilthead seabream in the table are all the wild sea bream that professional fishers caught in 2025. Greek marine aquaculture produced 65,097 tonnes of gilthead seabream in 2023, one hundred and sixty-six times more. For sea bass the ratio is even larger: 151.8 tonnes from fishing, 44,201 tonnes from aquaculture, two hundred and ninety-one times.
In total, aquaculture produced 127,493 tonnes worth €689.36 million in 2024. That is triple the tonnes and four times the value of all professional sea fishing.
The producer price does not follow the same pattern in every species. Farmed sea bream sold at €4.89 per kg in 2023 and wild sea bream at €4.19 in 2025. For sea bass the wild fish was more expensive, €7.48 against €6.45.
Greece in the Mediterranean
Eurostat publishes the same division ready-made, as unit EUR_T in the dataset fish_ld_main.
For 2025 there is data only for Greece, so the comparison uses 2024:
| country | price at the boat | landings |
|---|---|---|
| Cyprus | €5.54 | 908 tonnes |
| Italy | €5.46 | 125,338 tonnes |
| Greece | €4.79 | 55,104 tonnes |
| Spain | €3.46 | 479,234 tonnes |
| France | €3.23 | 265,065 tonnes |
| Portugal | €2.69 | 136,039 tonnes |
| Croatia | €1.51 | 41,909 tonnes |
Greece is third in price per kg among the seven Mediterranean countries, triple Croatia. The ranking does not follow the size of the fleet or of the landings: Spain lands eight times the tonnes of Greece and is paid less per kg. The €4.79 of 2024 does not compare with the €3.96 of 2025, for the reason explained in the methodology.
The blue crab
Blue crab comes in at 454.7 tonnes, more than sea bass, lobster and mussels together (222.3 tonnes). It is paid €1.54 per kg, the seventh cheapest of the 46 species in the table, and brings €702,100.
It is an invasive species that spread in the Aegean and the Ionian over the last decade. In the release it appears as a row with volume and price, like any other species.
Methodology
The source is the ELSTAT press release "Sea Fisheries: Year 2025", published on 27 August 2026. I
took it as a PDF and read it with pdftotext -layout. The prices per kg are my own division of the
value column by the quantity column of Table 3. They are first-sale prices, at the boat. Whatever
is added from there to the market stall is not visible in this release, and the consumer price
does not come from here.
Table 3 has 46 named species and three aggregate rows, "Other fish", "Other crustaceans" and "Other molluscs", which together are 8.6% of the tonnes and 10.9% of the value. The species table shows the 46. The price bands and the shares were calculated on all 49 rows, so that they add up to the national total.
No comparison with last year. From 2025 ELSTAT changed its source, from a sample survey to
administrative data from the fisheries monitoring system, and in the Eurostat series the catch
goes from 55,104 tonnes in 2024 to 41,561 in 2025. The 25% fall is a break in the series, not a
fall in catch. The comparison with the other Mediterranean countries comes from Eurostat's
fish_ld_main, retrieved on 28 August 2026, for 2024 because 2025 has not been published for the
others. Aquaculture comes from fish_aq2a, from the same source.
The release covers only professional sea fishing by motor-propelled vessels. It leaves out aquaculture, recreational fishing, lakes and imports. It also covers only what is sold: the silver-cheeked toadfish will never be a row, because EU food law bans its sale, while the lionfish sells normally. Finally, first-sale value is not a fisher's income: fuel, gear, crew and the fish auction commission come out of it.
Frequently asked questions
What does fish sell for at the boat in Greece?
Which fish brings the most money to Greek fisheries?
Is the sea bream eaten in Greece from fishing or from aquaculture?
Why does the 2025 catch in Greece not compare with earlier years?
How many fishing vessels are there in Greece and what do they catch?
Sources
- ELSTAT (Hellenic Statistical Authority), Sea Fisheries: Year 2025, press release 27/08/2026 accessed 28 Αυγούστου 2026
- Eurostat, fish_ld_main, landings of fishery products, unit EUR_T accessed 28 Αυγούστου 2026
- Eurostat, fish_aq2a, aquaculture production accessed 28 Αυγούστου 2026
Data snapshot taken on 28 Αυγούστου 2026.
The bizlist.gr analyses are information drawn from public data and do not constitute tax, accounting, legal or financial advice.
Try it yourself
The same filters used in this analysis, ready to run.
A full study of your industry?
Companies, revenue, profit and the largest players in your industry, across Greece. Free for subscribers.