How many businesses open and how many close in Greece
In 2025, 84,031 businesses registered in Greece and 27,355 were deleted, a ten-year record for registrations. The first seven months of 2026 are 11.8% lower, but no sector is shrinking.
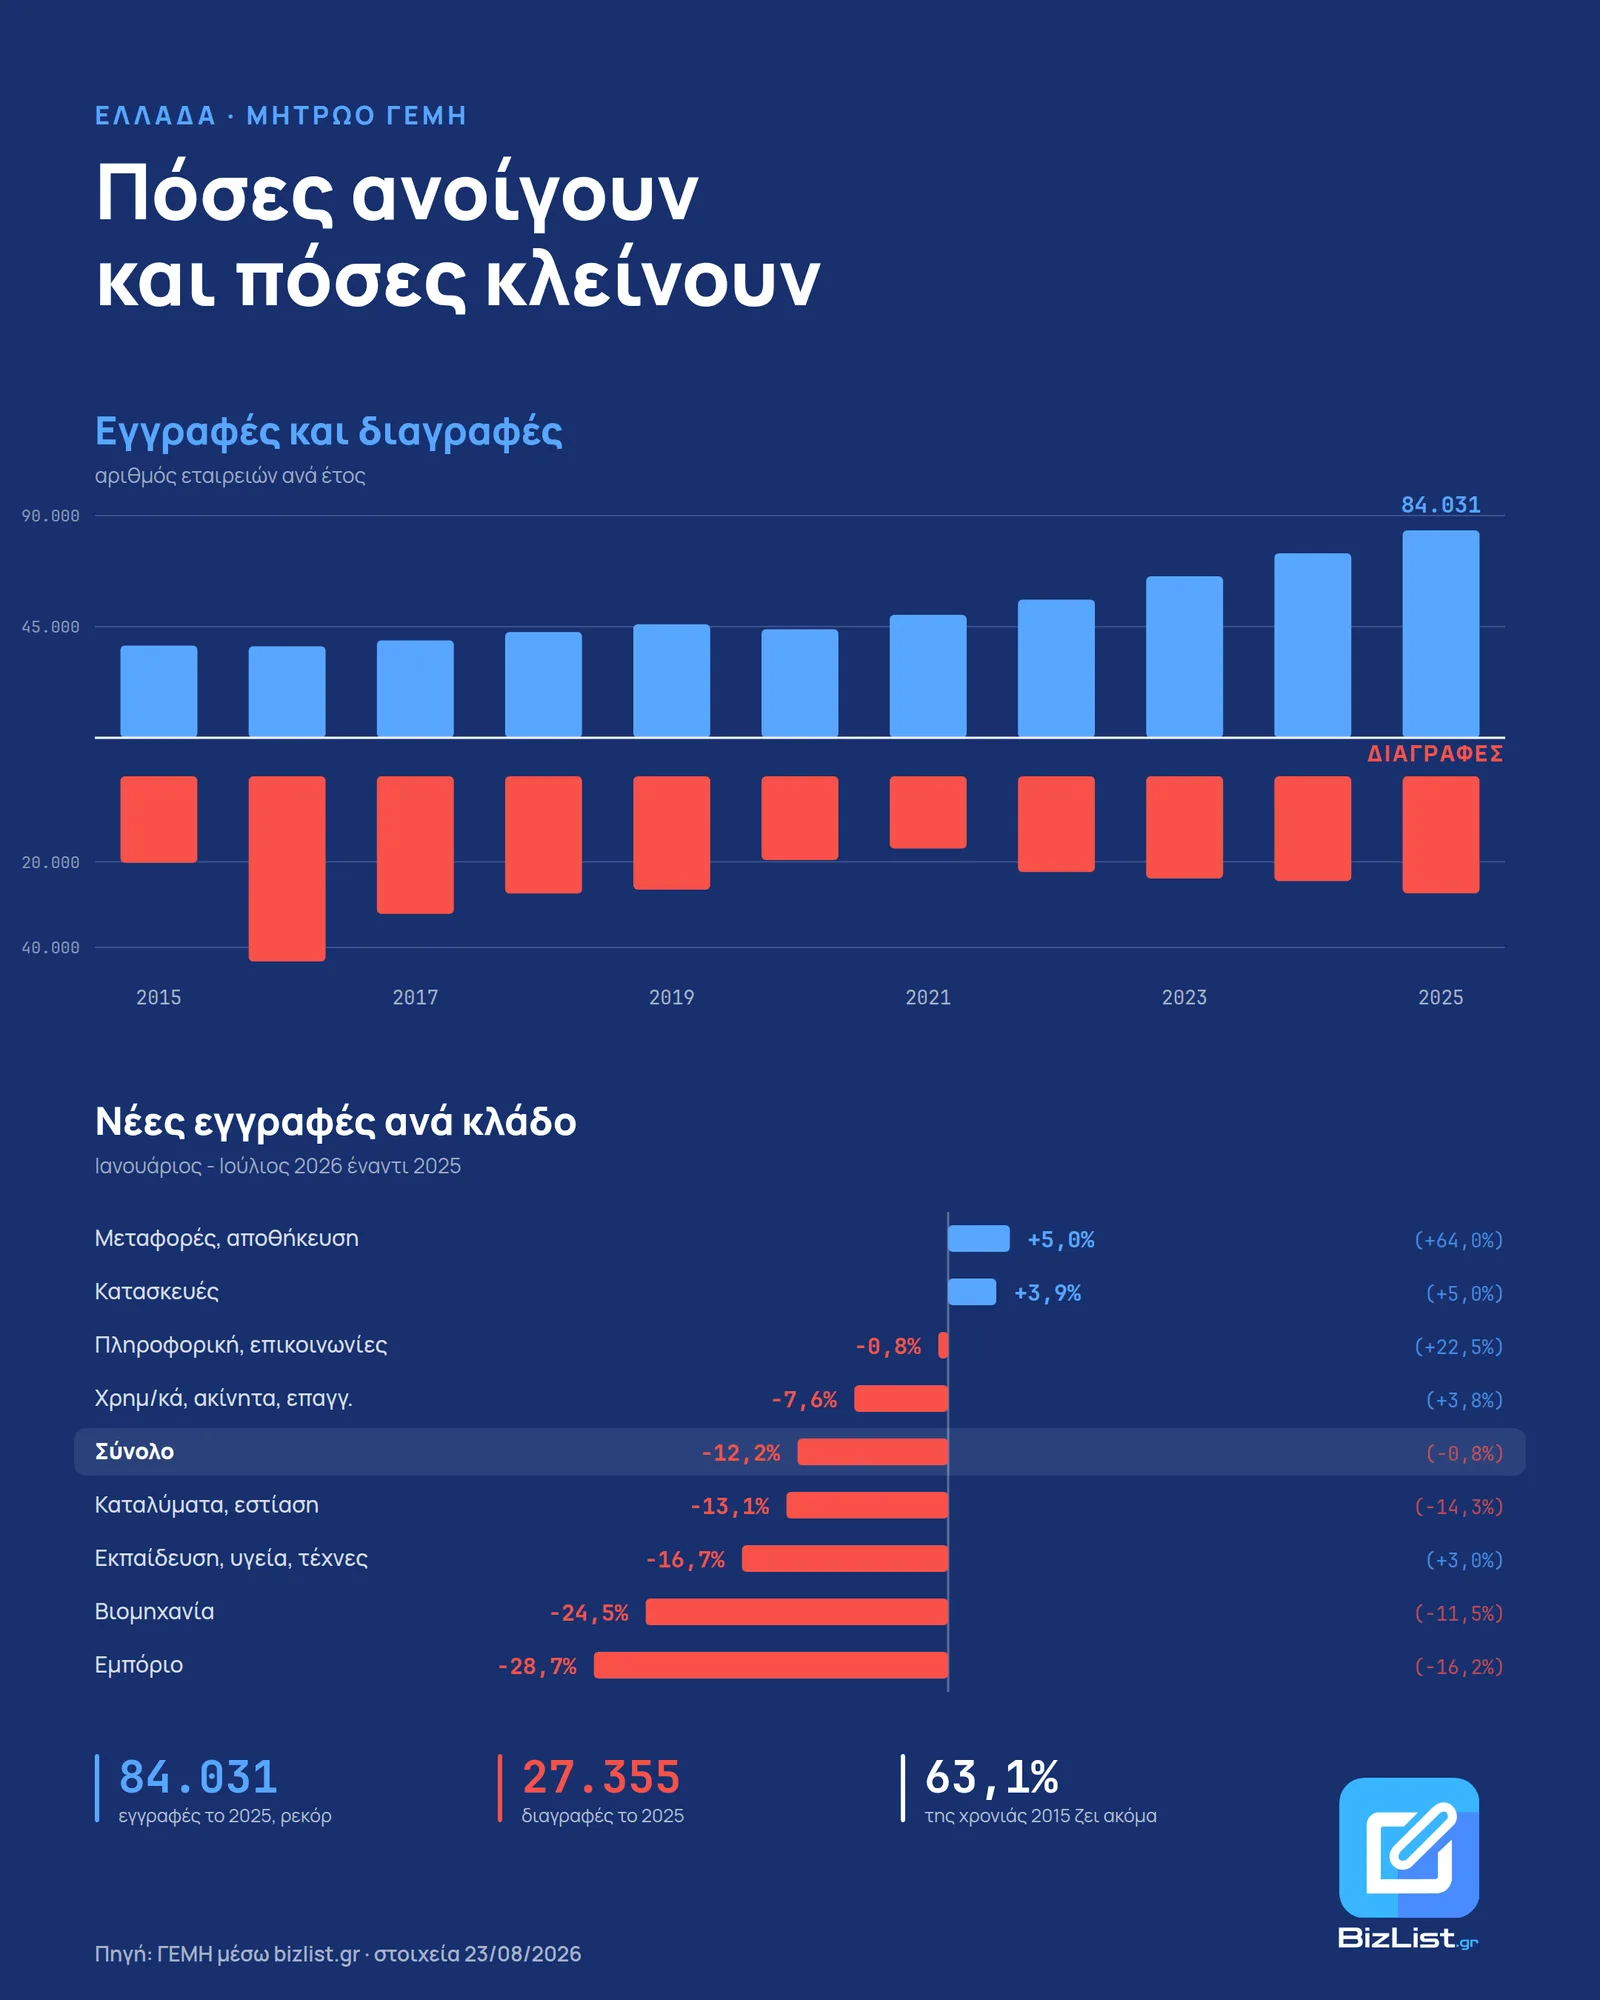
In 2025, GEMI, the Greek General Commercial Registry, recorded 84,031 new registrations and 27,355 deletions. It is the highest number of registrations in the decade, and the fifth year of growth in a row.
The first seven months of 2026 turned, though. From January to July, new registrations are 11.8% below last year.
The decade in one series
| year | registrations |
|---|---|
| 2015 | 37,384 |
| 2020 | 43,966 |
| 2023 | 65,385 |
| 2024 | 74,674 |
| 2025 | 84,031 |
Deletions did not follow the same slope. They went from 20,223 in 2015 to 27,355 in 2025, which is +35% while registrations grew +125%.
| year | registrations | deletions | net |
|---|---|---|---|
| 2015 | 37,384 | 20,223 | +17,161 |
| 2020 | 43,966 | 19,563 | +24,403 |
| 2023 | 65,385 | 23,888 | +41,497 |
| 2024 | 74,674 | 24,489 | +50,185 |
| 2025 | 84,031 | 27,355 | +56,676 |
Of the companies registered in 2015, 63.1% still exist.
The turning point
2026 does not continue the upward trend. In the first seven months:
| sector | 2024 | 2025 | 2026 | vs 2025 | vs 2024 |
|---|---|---|---|---|---|
| Transport, storage | 3,054 | 4,771 | 5,010 | +5.0% | +64.0% |
| Construction | 4,449 | 4,493 | 4,670 | +3.9% | +5.0% |
| IT, communications | 1,989 | 2,456 | 2,436 | −0.8% | +22.5% |
| Finance, real estate, professional | 10,566 | 11,869 | 10,963 | −7.6% | +3.8% |
| Total | 42,625 | 49,021 | 43,243 | −11.8% | +1.4% |
| Accommodation, food service | 7,367 | 7,258 | 6,310 | −13.1% | −14.3% |
| Education, health, arts | 5,273 | 6,521 | 5,432 | −16.7% | +3.0% |
| Manufacturing | 2,270 | 2,661 | 2,009 | −24.5% | −11.5% |
| Trade | 7,657 | 8,992 | 6,413 | −28.7% | −16.2% |
The "vs 2024" column is there for a specific reason. 2025 was abnormally high, with a bubble from May to July that reached +50% over the same months of 2024. If you compare only with 2025, everything comes out negative and the conclusion is "shrinking". Against 2024, the total is +1.4%.
So the first seven months of 2026 are not a bad year. They are a return to 2024 levels, after one year that broke away.
No sector is shrinking
"−28.7% in trade" is easy to read as "trade is contracting". That is not what it says. It is a change in new registrations, not in the size of the sector.
January to July 2026, formations against deletions:
| sector | formations | deletions | net |
|---|---|---|---|
| Trade | 6,413 | 1,642 | +4,771 |
| Accommodation, food service | 6,309 | 1,301 | +5,008 |
| Manufacturing | 2,009 | 637 | +1,372 |
Every sector is net positive, and by a wide margin. The sectors are still growing. What slows down is the pace.
The deletions here are a lower bound. I have ~44% of what GEMI reports for the seven months, because deletions are recorded with a delay. Even at three times the number, no sign turns.
Transport is the only true growth story: +64% against 2024, with couriers and delivery included.
How it was built
I started from Eurostat STS_RB_Q, which gives registrations and bankruptcies by quarter and by sector. I dropped it.
The reason: in 2025 there were 943 bankruptcy declarations against 27,355 deletions. Bankruptcy is 1 in 29 of the cases in which a company leaves the registry. A chart of "registrations against bankruptcies" measures something real, but not what the reader thinks it measures.
I rebuilt it with deletions, directly from GEMI. Formations by sector and region are updated daily on the new companies page, and the totals are in the business statistics.
Methodology
The annual totals come from the GEMI totals. The breakdown by sector comes from my own database, so the question was completeness:
| Jan-Jul | mine | GEMI | coverage |
|---|---|---|---|
| 2024 | 48,346 | 48,032 | 100.7% |
| 2025 | 54,085 | 54,263 | 99.7% |
| 2026 | 47,939 | 47,644 | 100.6% |
The independent check: my total gives −11.8%, the GEMI totals give −12.2%. A gap of 0.4 percentage points. Before the catch-up of backdated registrations, the same comparison gave a gap of 2.2 points, and three sectors came out with the opposite sign.
Every comparison is January to July in all three years. Data snapshot 23/08/2026.
What these numbers do not measure
Registrations in GEMI, not new businesses. Sole proprietorships that register only with AADE, the Greek tax authority, never pass through GEMI. Eurostat gives 63,597 business births in 2021, GEMI 49,820.
Deletions from GEMI, not closures. In 2023 Eurostat counts 31,628 closures, GEMI 23,888 deletions. A business can stop operating years before it is deleted.
The survival of one cohort of companies compares only with a cohort of the same age. The 94.9% for 2025 does not mean that the 2025 companies are more resilient than those of 2015. It means they have not had time to close yet. That is why the text uses only the 63.1% of 2015.
Frequently asked questions
How many new businesses were founded in Greece in 2025?
Do more businesses close than open in Greece?
Is deletion from GEMI the same as bankruptcy?
Sources
- GEMI (Greece), annual and monthly totals accessed 23 Αυγούστου 2026
- GEMI registry via bizlist.gr
- Eurostat STS_RB_Q, registrations and bankruptcies by quarter accessed 17 Αυγούστου 2026
- Eurostat bd_size, business demography accessed 17 Αυγούστου 2026
Data snapshot taken on 23 Αυγούστου 2026.
The bizlist.gr analyses are information drawn from public data and do not constitute tax, accounting, legal or financial advice.
Try it yourself
The same filters used in this analysis, ready to run.
A full study of your industry?
Companies, revenue, profit and the largest players in your industry, across Greece. Free for subscribers.